Introduction
Tumor Immune Single-cell Hub (TISCH) is a scRNA-seq database, which aims to characterize tumor microenvironment at single-cell resolution.
Data collection and processing
We collected tumor-related scRNA-seq studies from human and mouse. Besides datasets of treatment-naive patients, those with samples treated are also included. For each collected dataset, a uniform analysis pipeline -- MAESTRO was adopted to perform quality control, clustering and cell-type annotation (Fig. 1). After the streamlined processing, we curated the cell-type annotation of all datasets at three levels: malignancy, major-lineage and minor-lineage (Fig. 2). The curation makes the gene expression in different cell types comparable across all datasets.
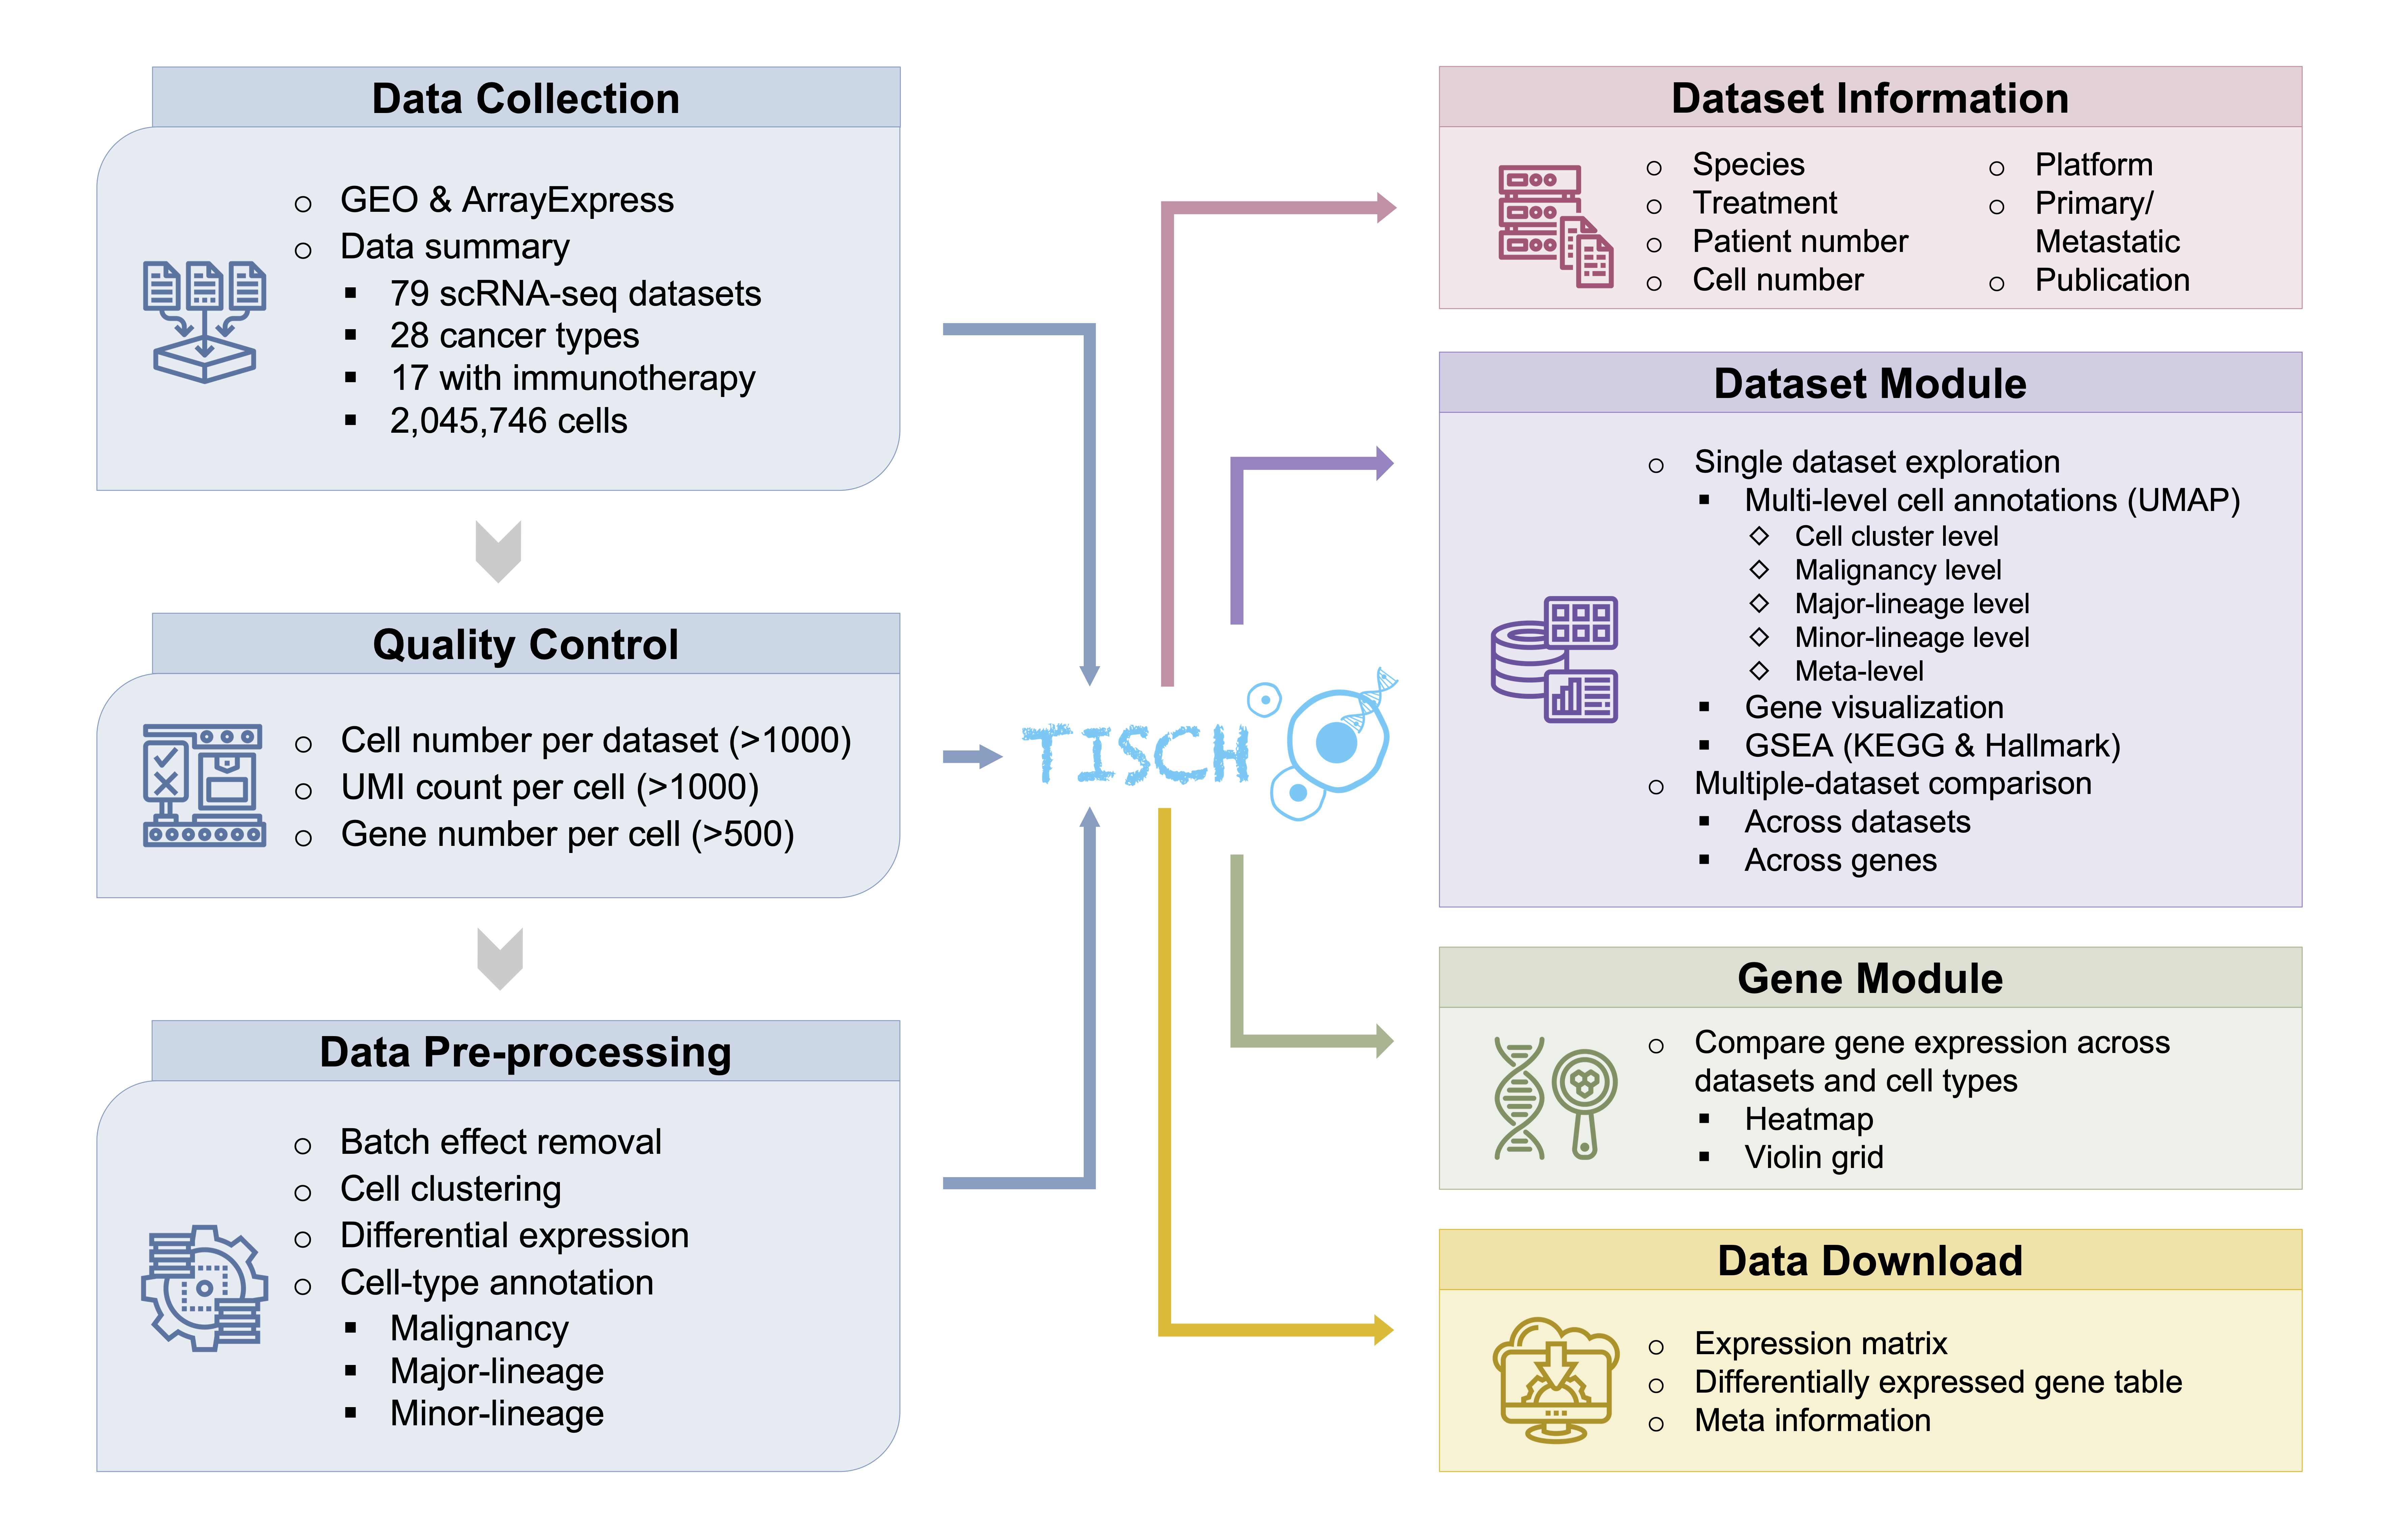

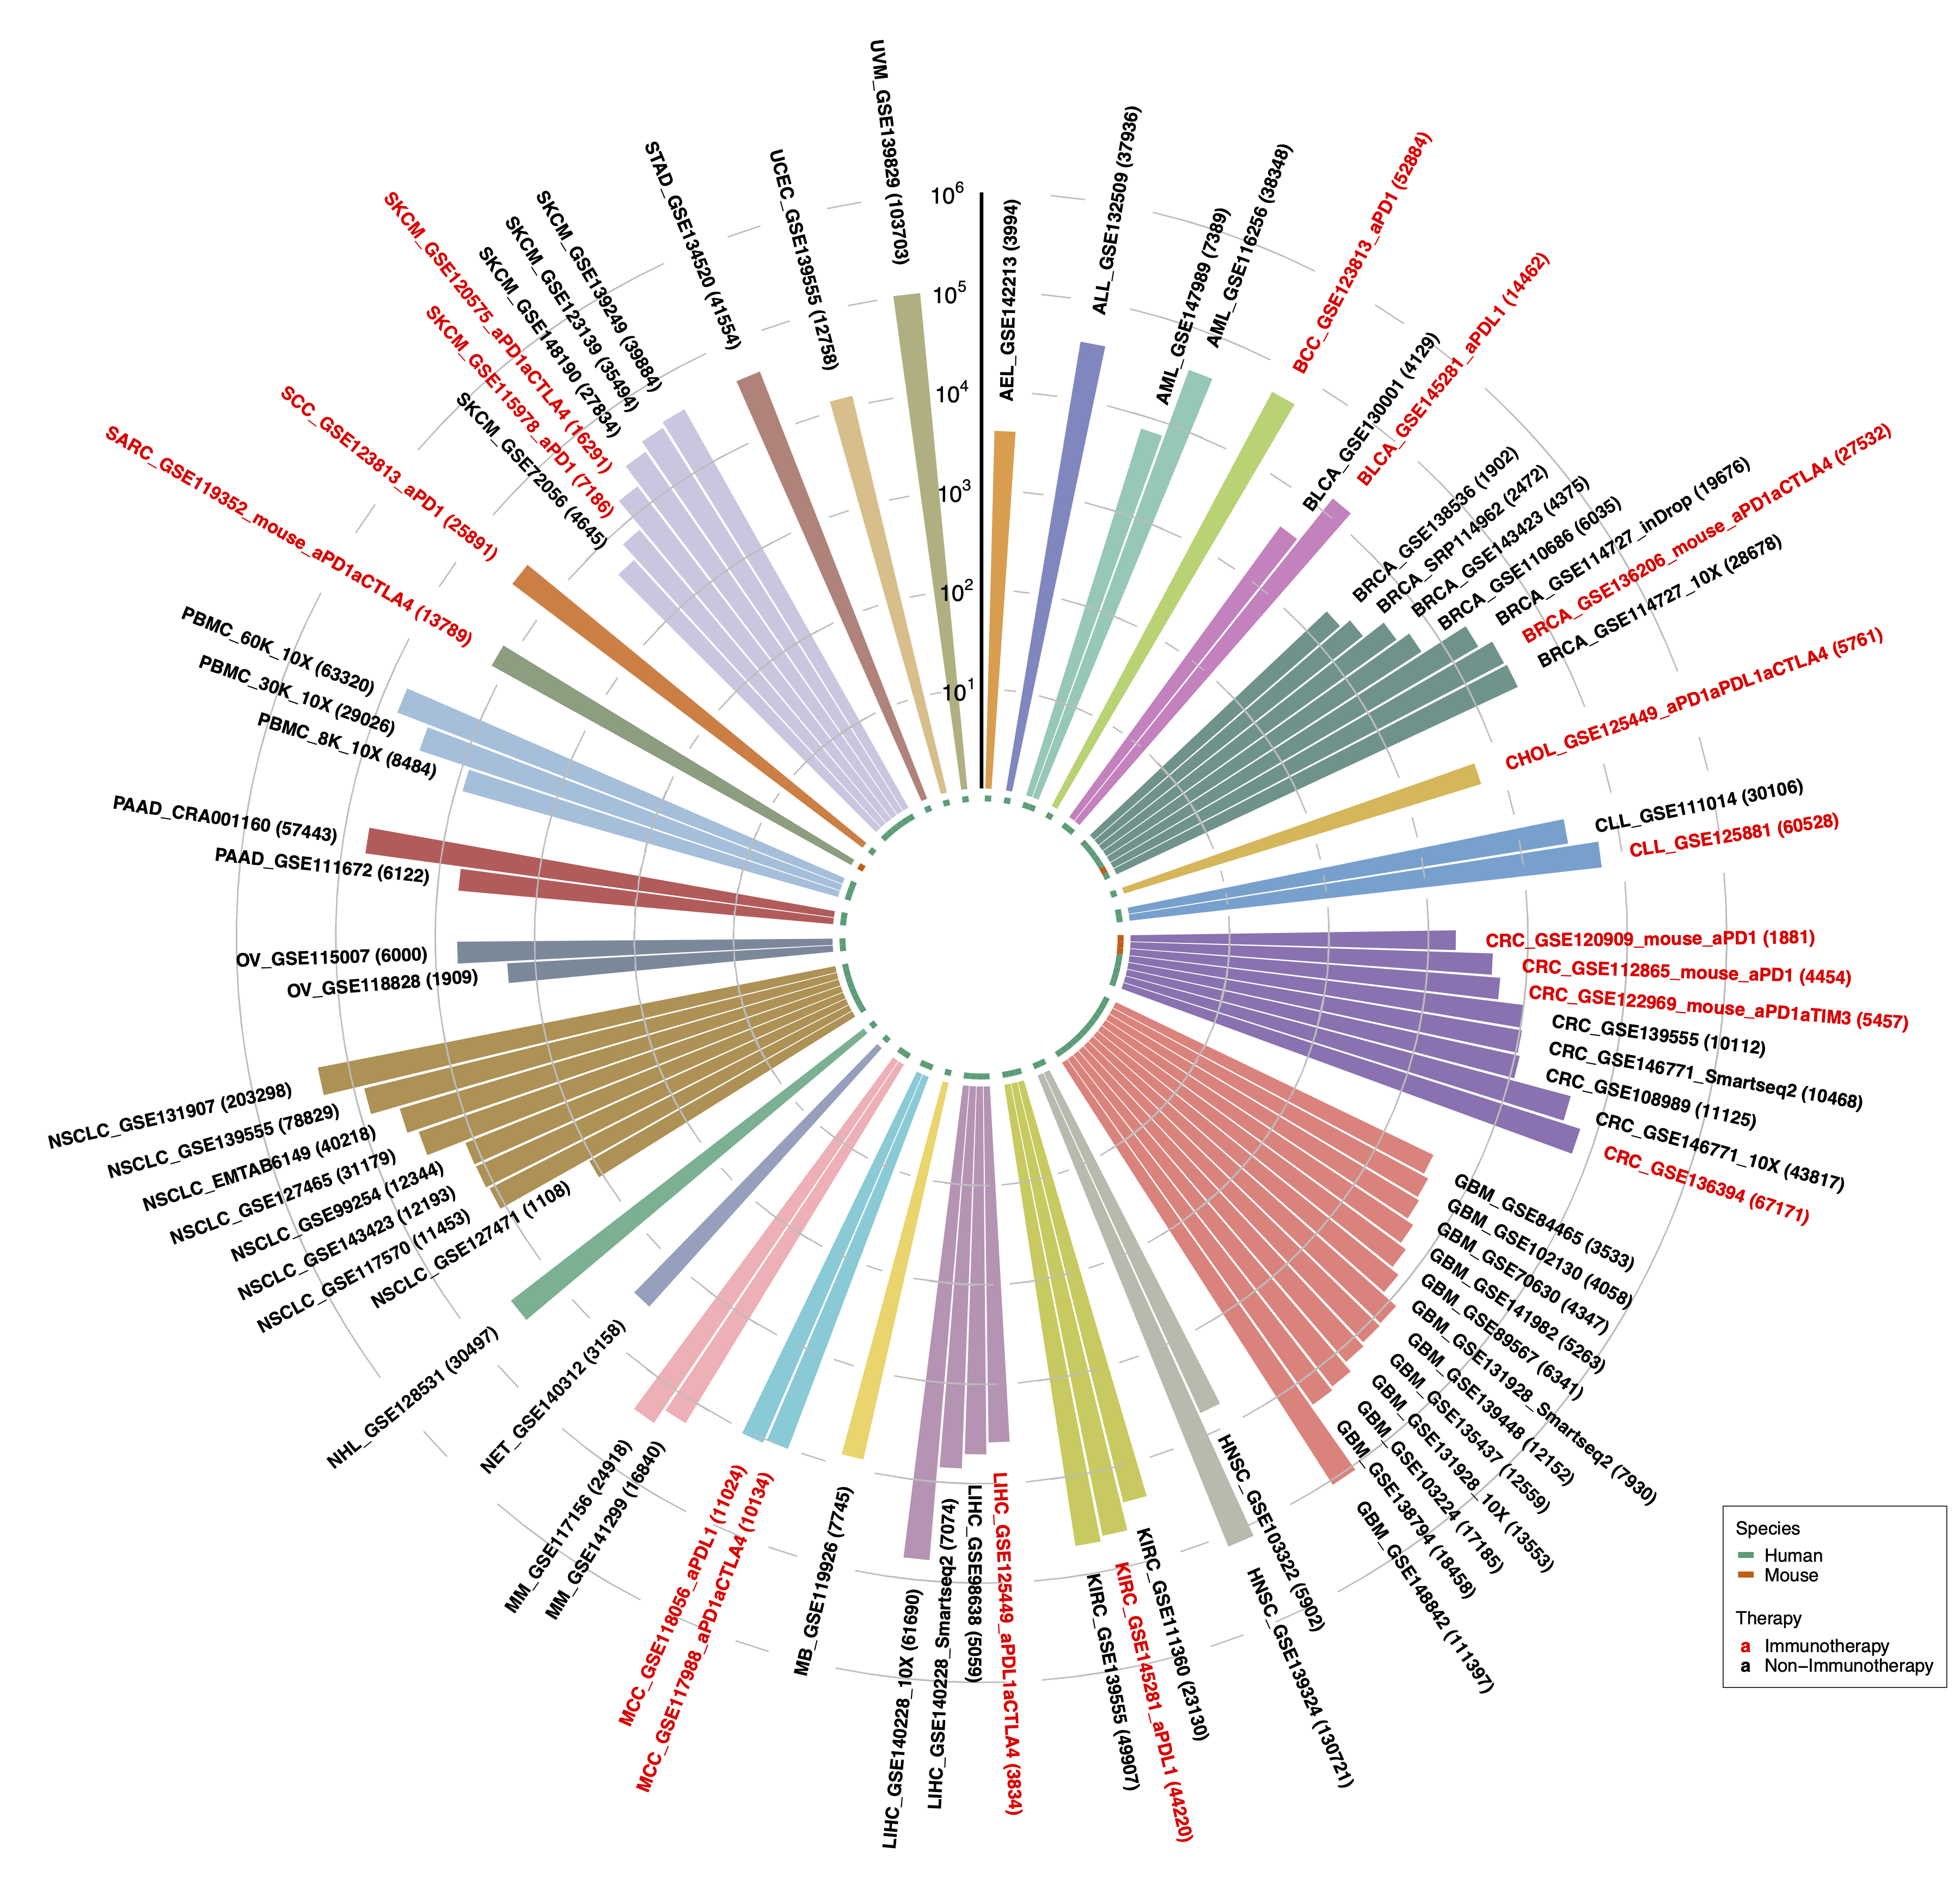
Currently, after quality control, a total of 1,944,551 cells from 76 datasets across 28 cancer types and 101,195 cells from 3 PBMC datasets are retained in TISCH (Fig. 3).
Function of TISCH
Based on the unified data processing, TISCH presents the analysis results in a user-friendly interface for public accessing, which allows researchers to gain a quick insight into the expression of genes of interest at the single-cell level (Fig. 1).
Usage
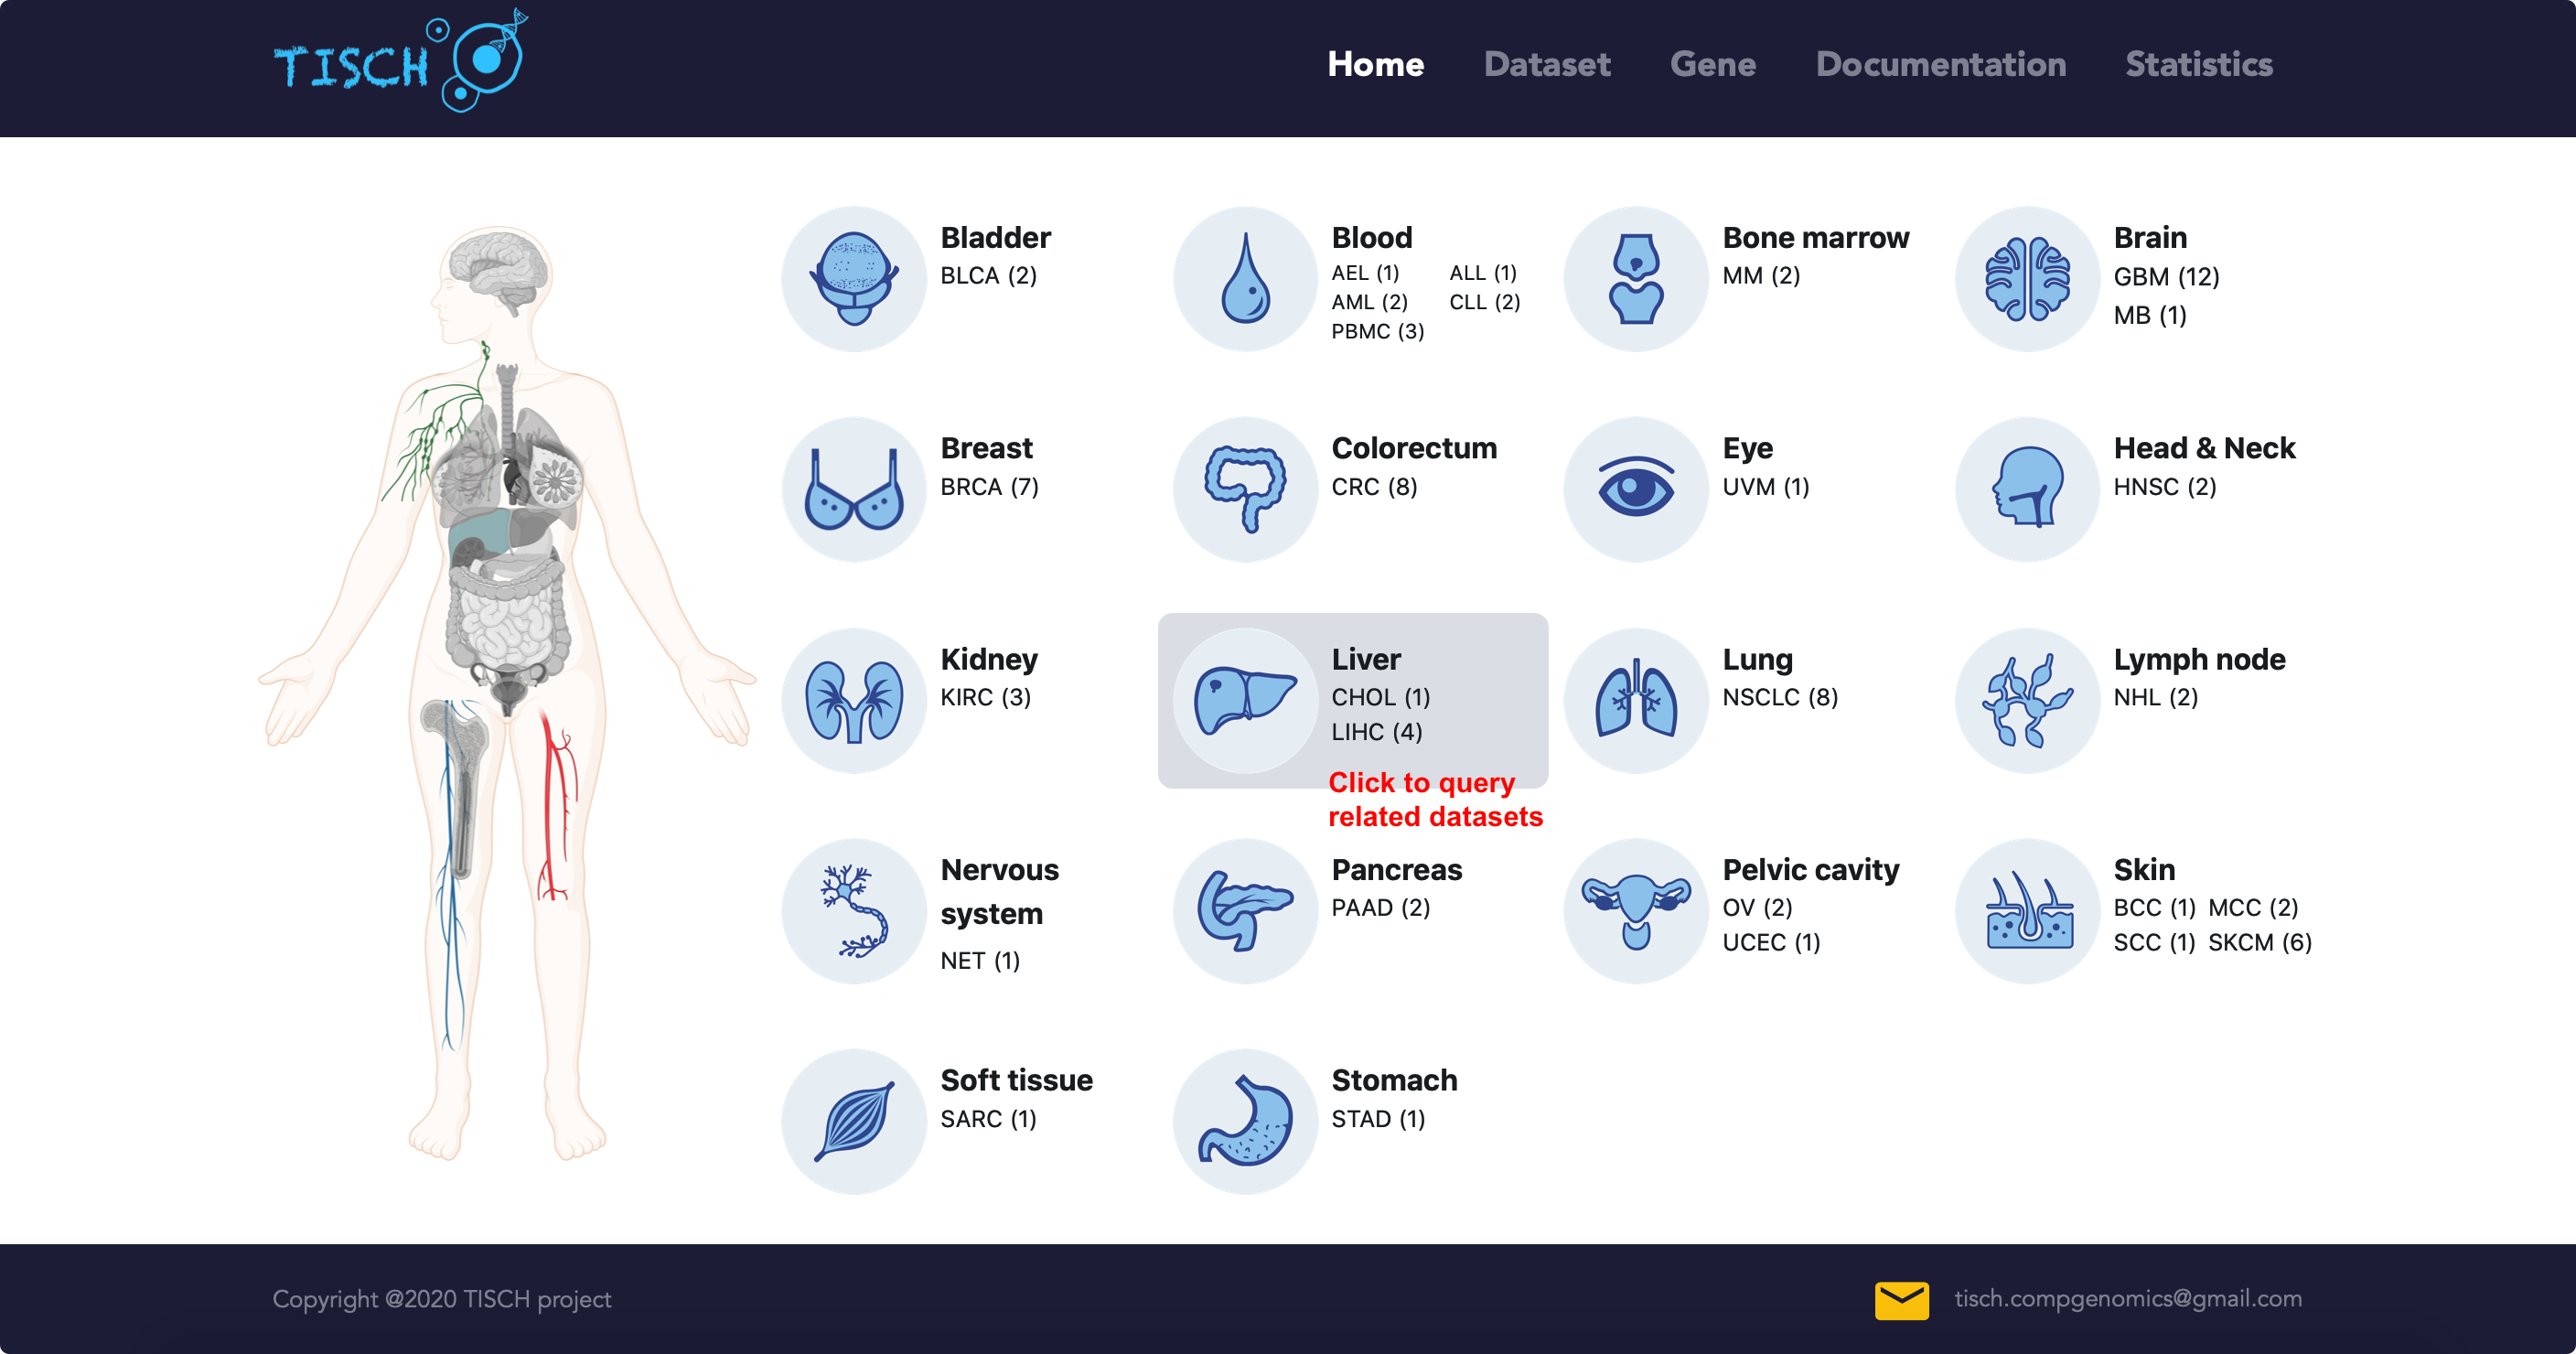
Starting from a cancer type
If users are interested in one cancer type, they can click the tissue card in home page to query the related datasets.
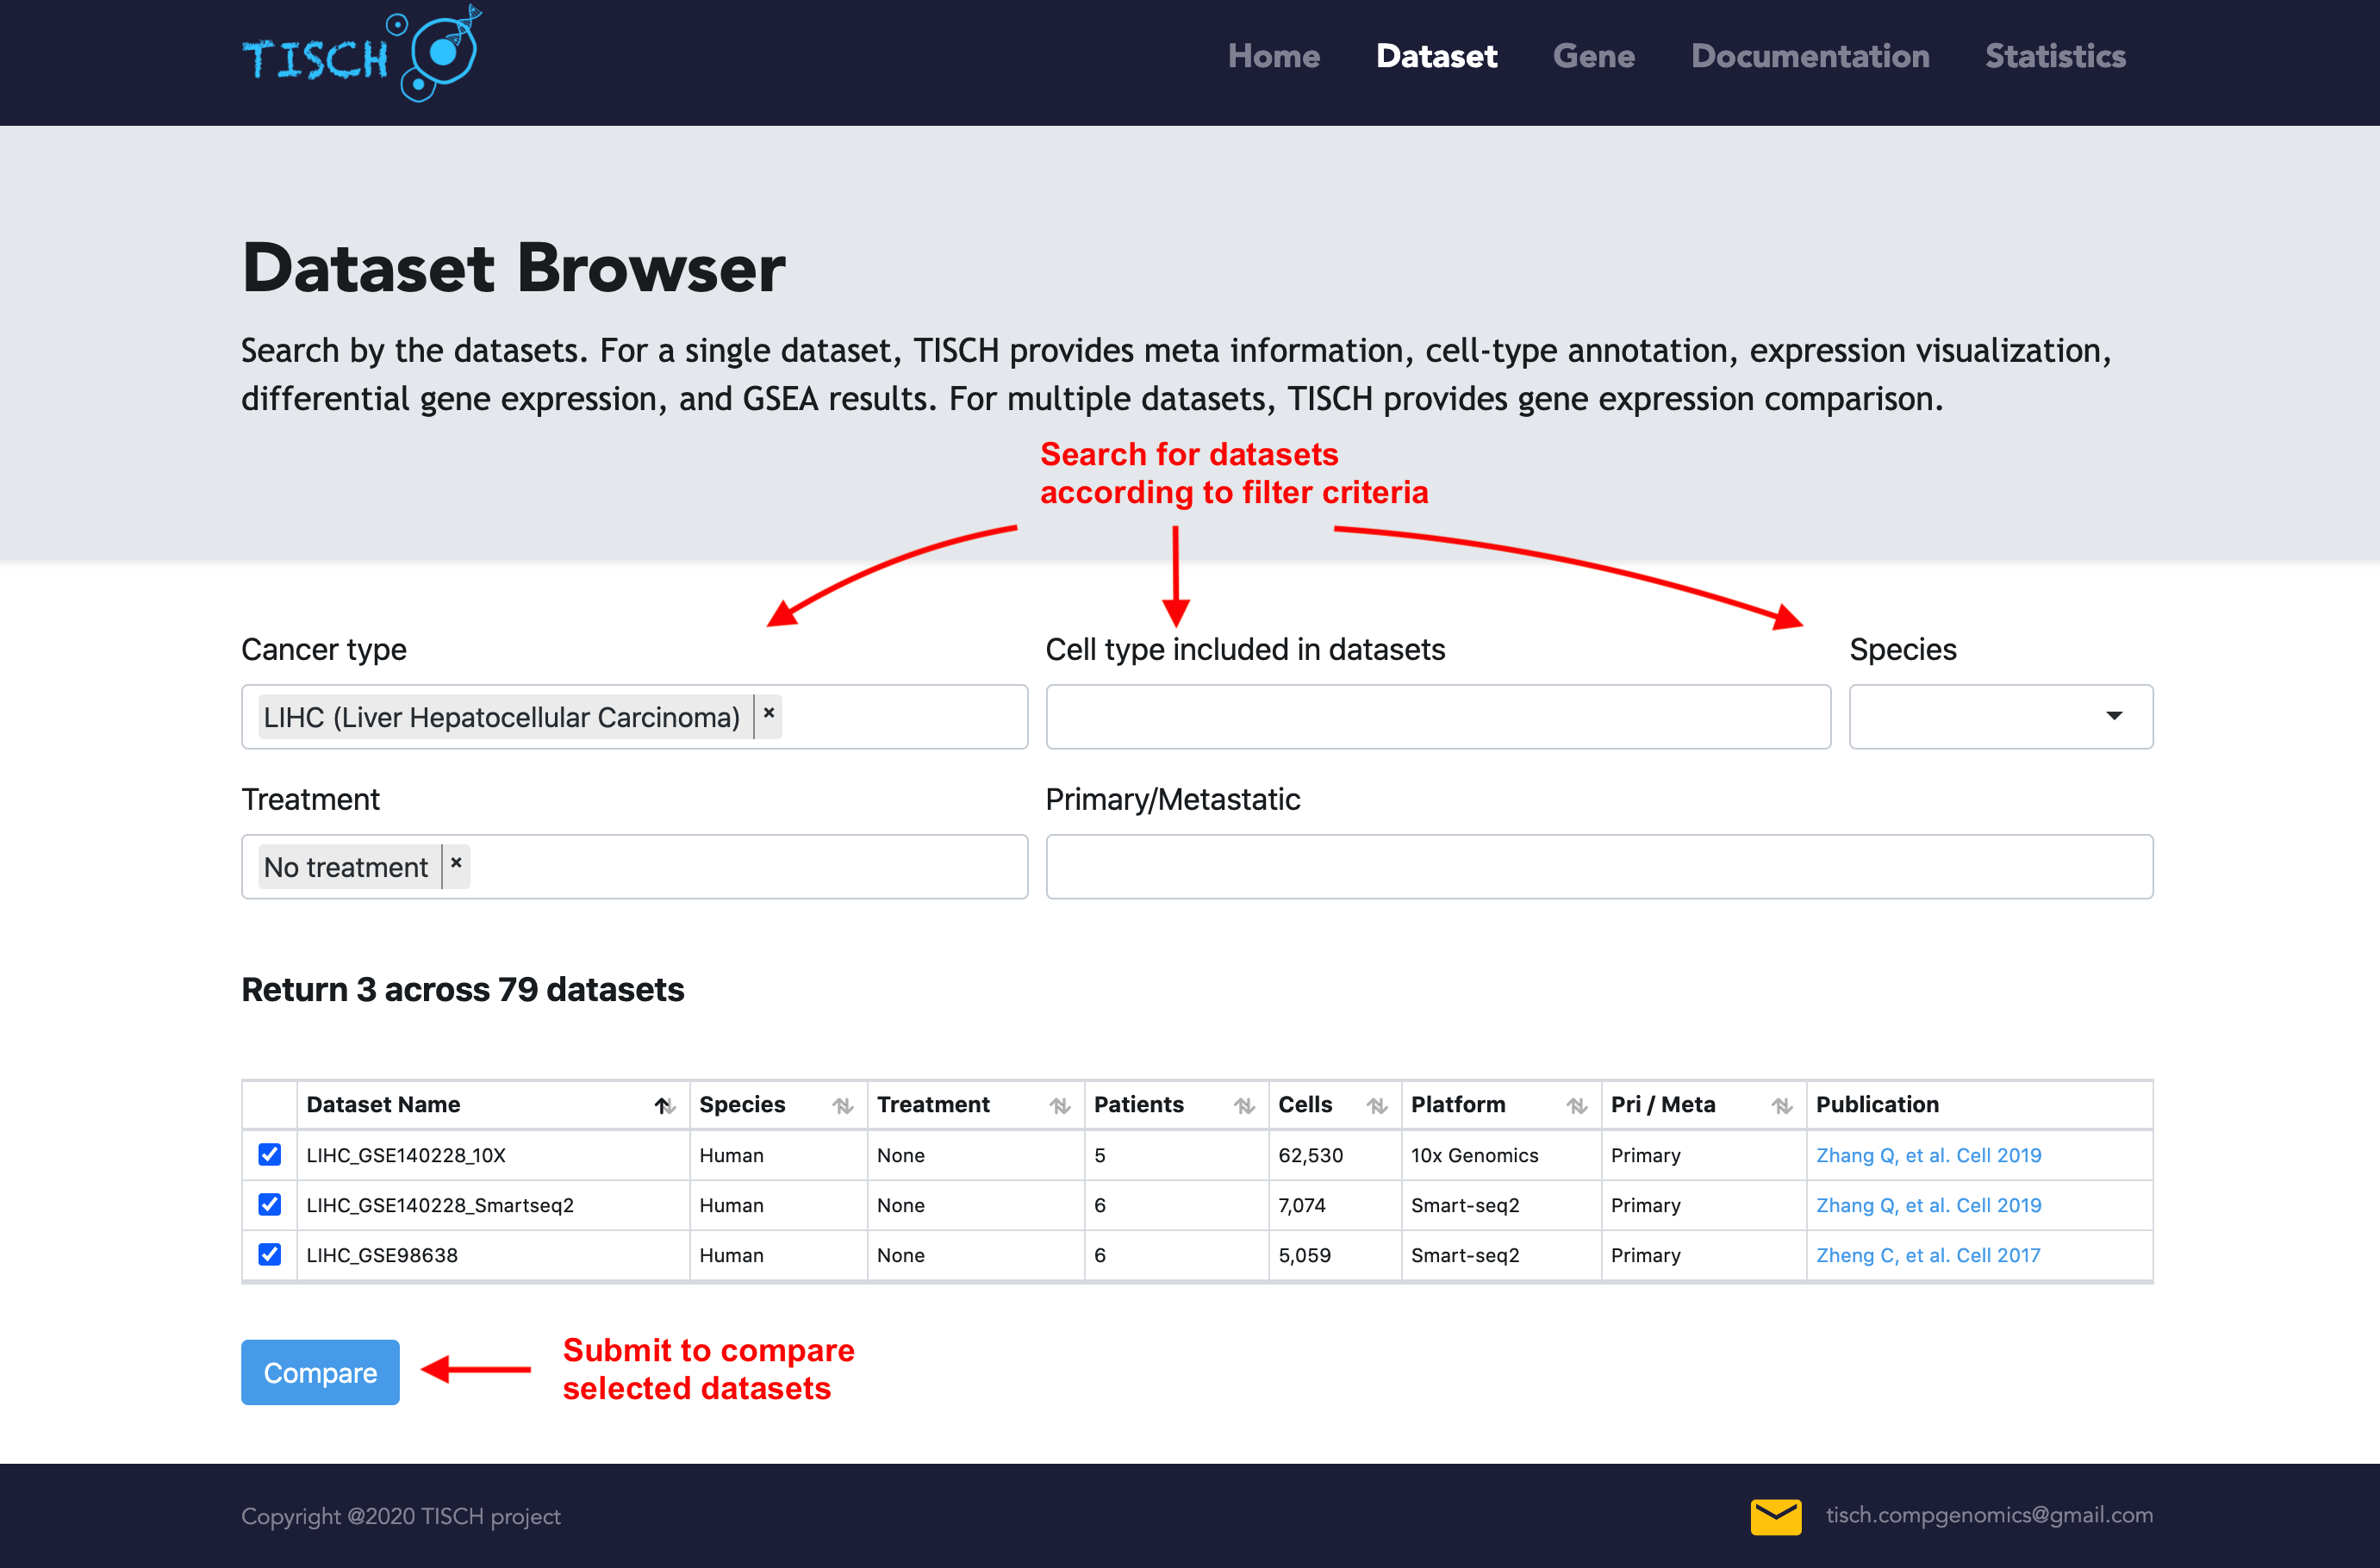
In the dataset page, users can further filter the query results according to other criteria. For example, users may be interested LIHC data from human patients without treatment. The datasets satisfying the conditions will be displayed as below.
Multiple-dataset comparison
Users can select multiple datasets and click the Submit button to take a quick look at the selected datasets at the same time. Then users can input genes of interest to compare the gene expression across datasets. Besides, users can explore the expression pattern of a gene signature by uploading a line-separated gene list file. The level of cell-type annotation could be switched.
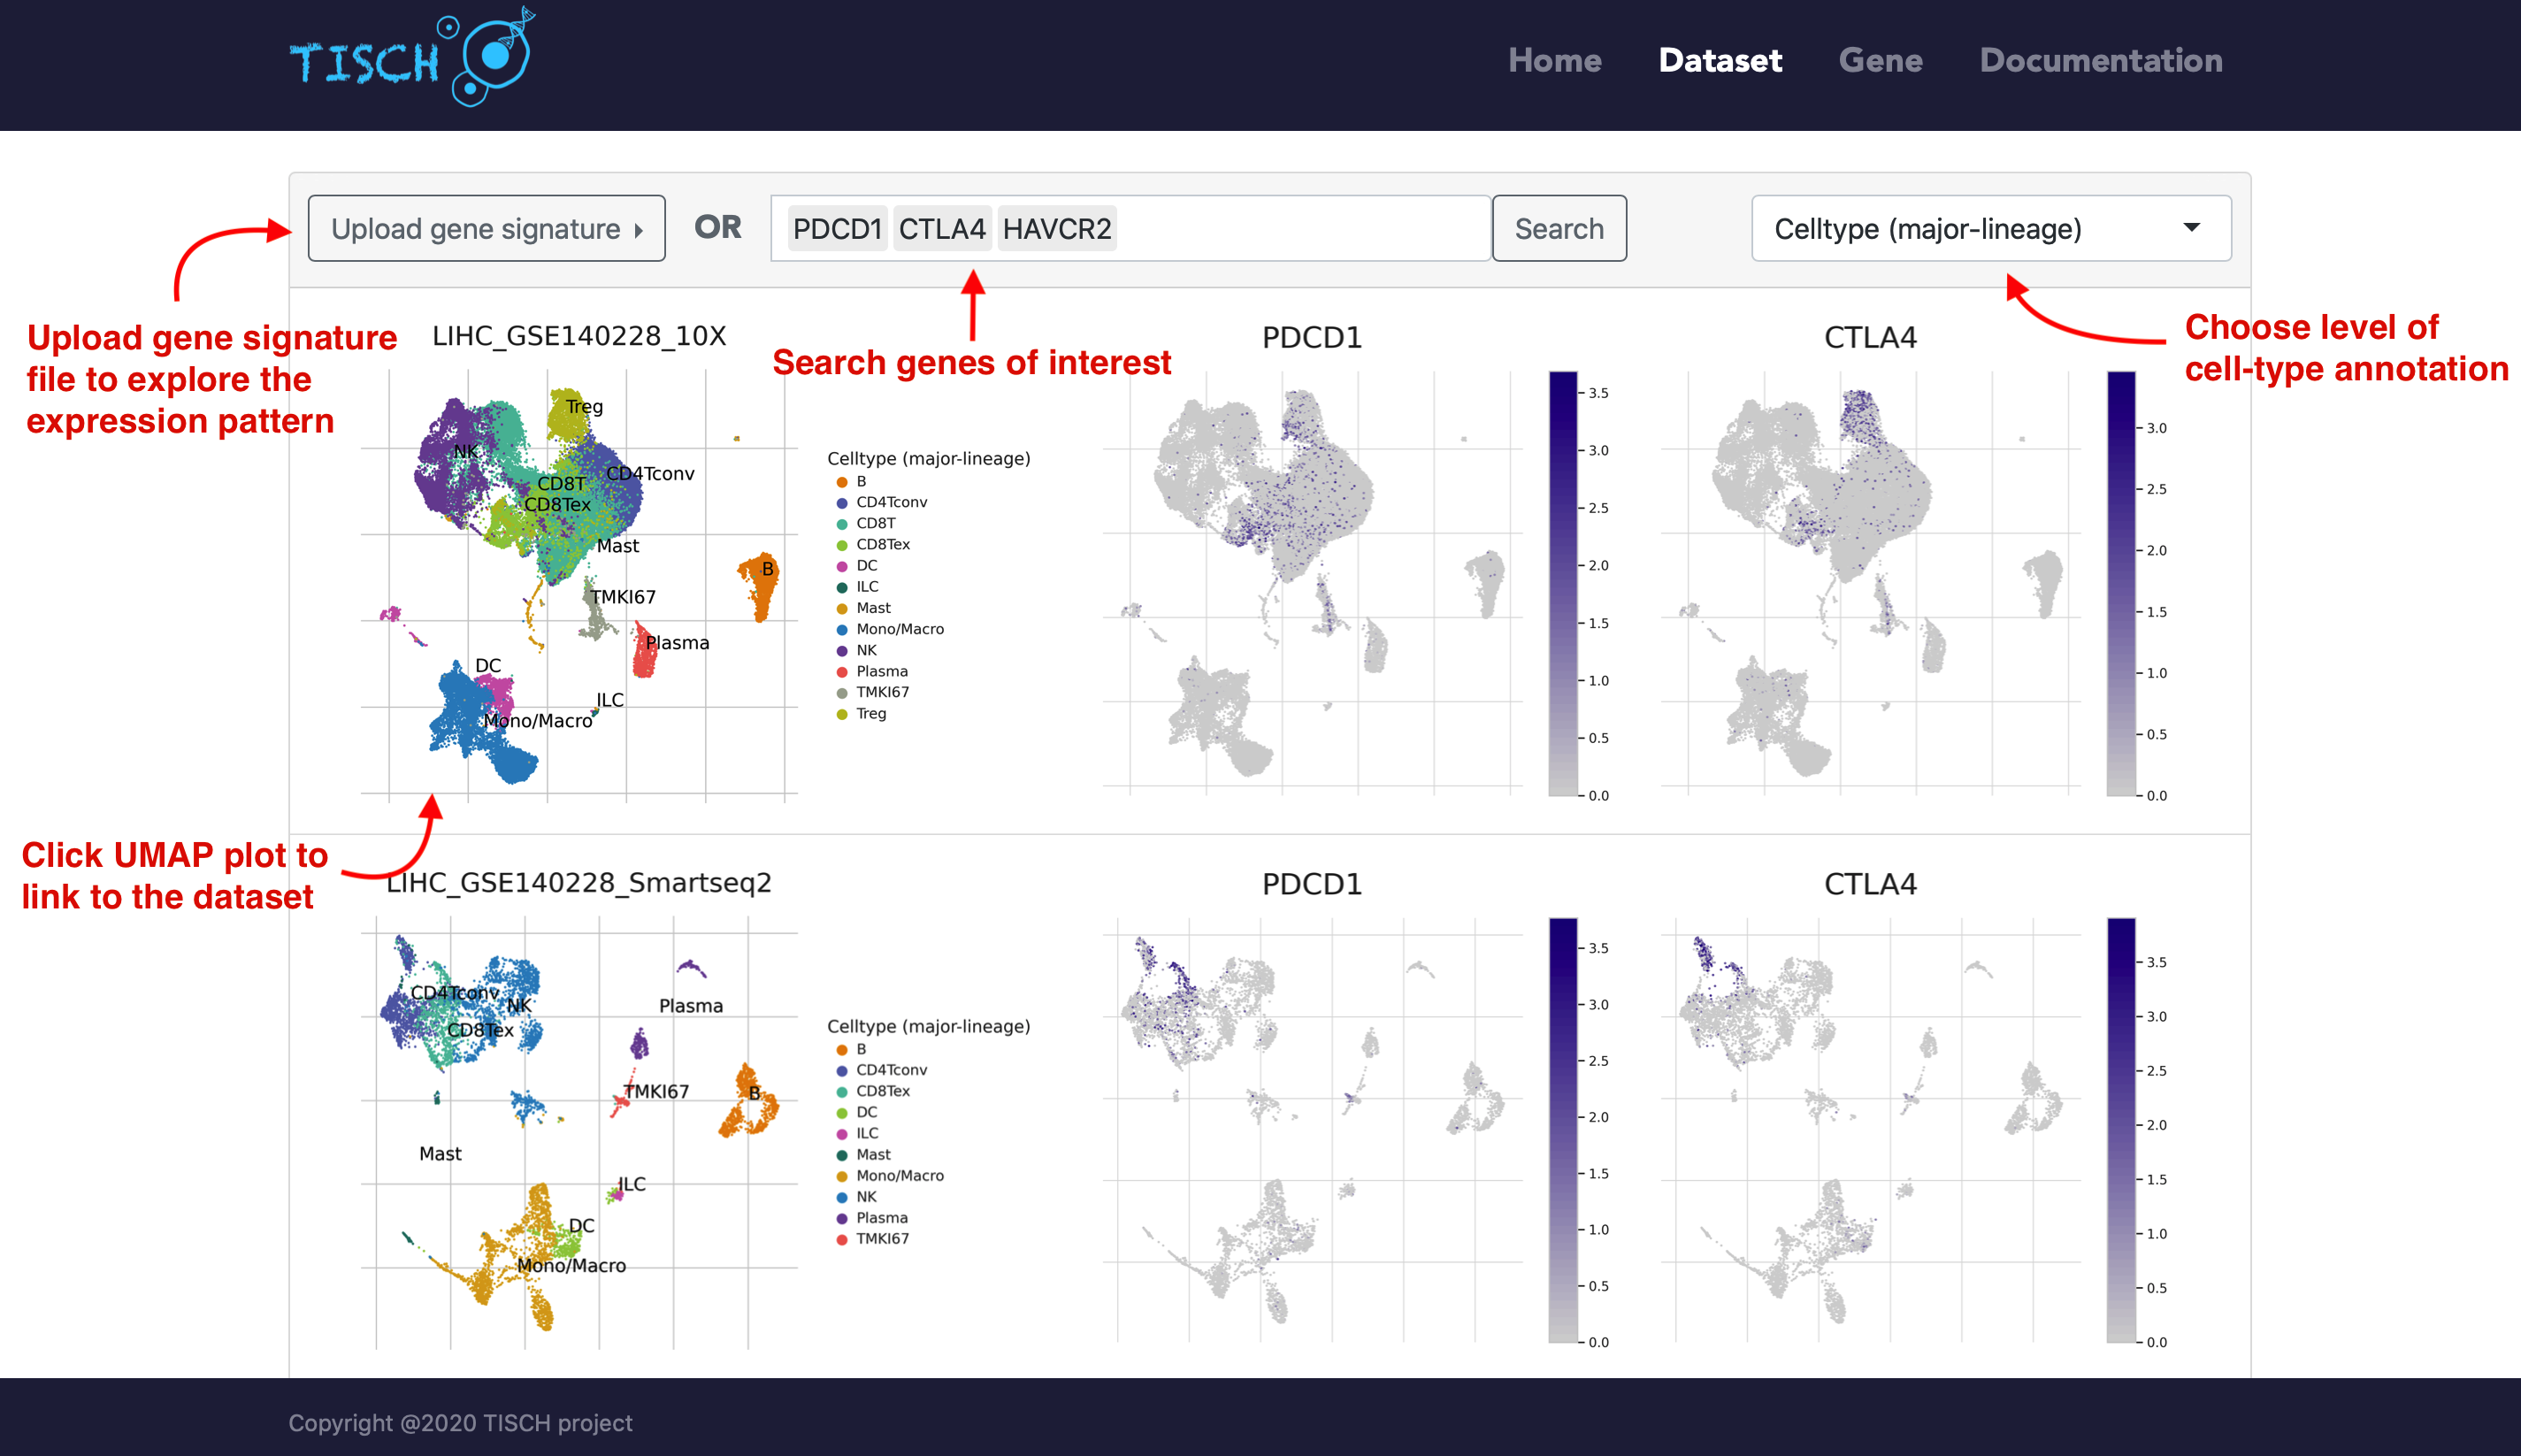
If users are interested one specific dataset, users can click the left annotated UMAP plot to achieve a comprehensive understanding of it. The page will be re-directed to the single-dataset page.
Single-dataset exploration
In the overview tab of single-dataset page, the clustering and annotation result are displayed on the top. Notably, users can click the right annotated UMAP plot to check the expression of cell-type-specific marker genes. As in the multiple-dataset page, the annotation of cells can be chosen from three levels of cell-type annotation as well as meta information from original study (if available).
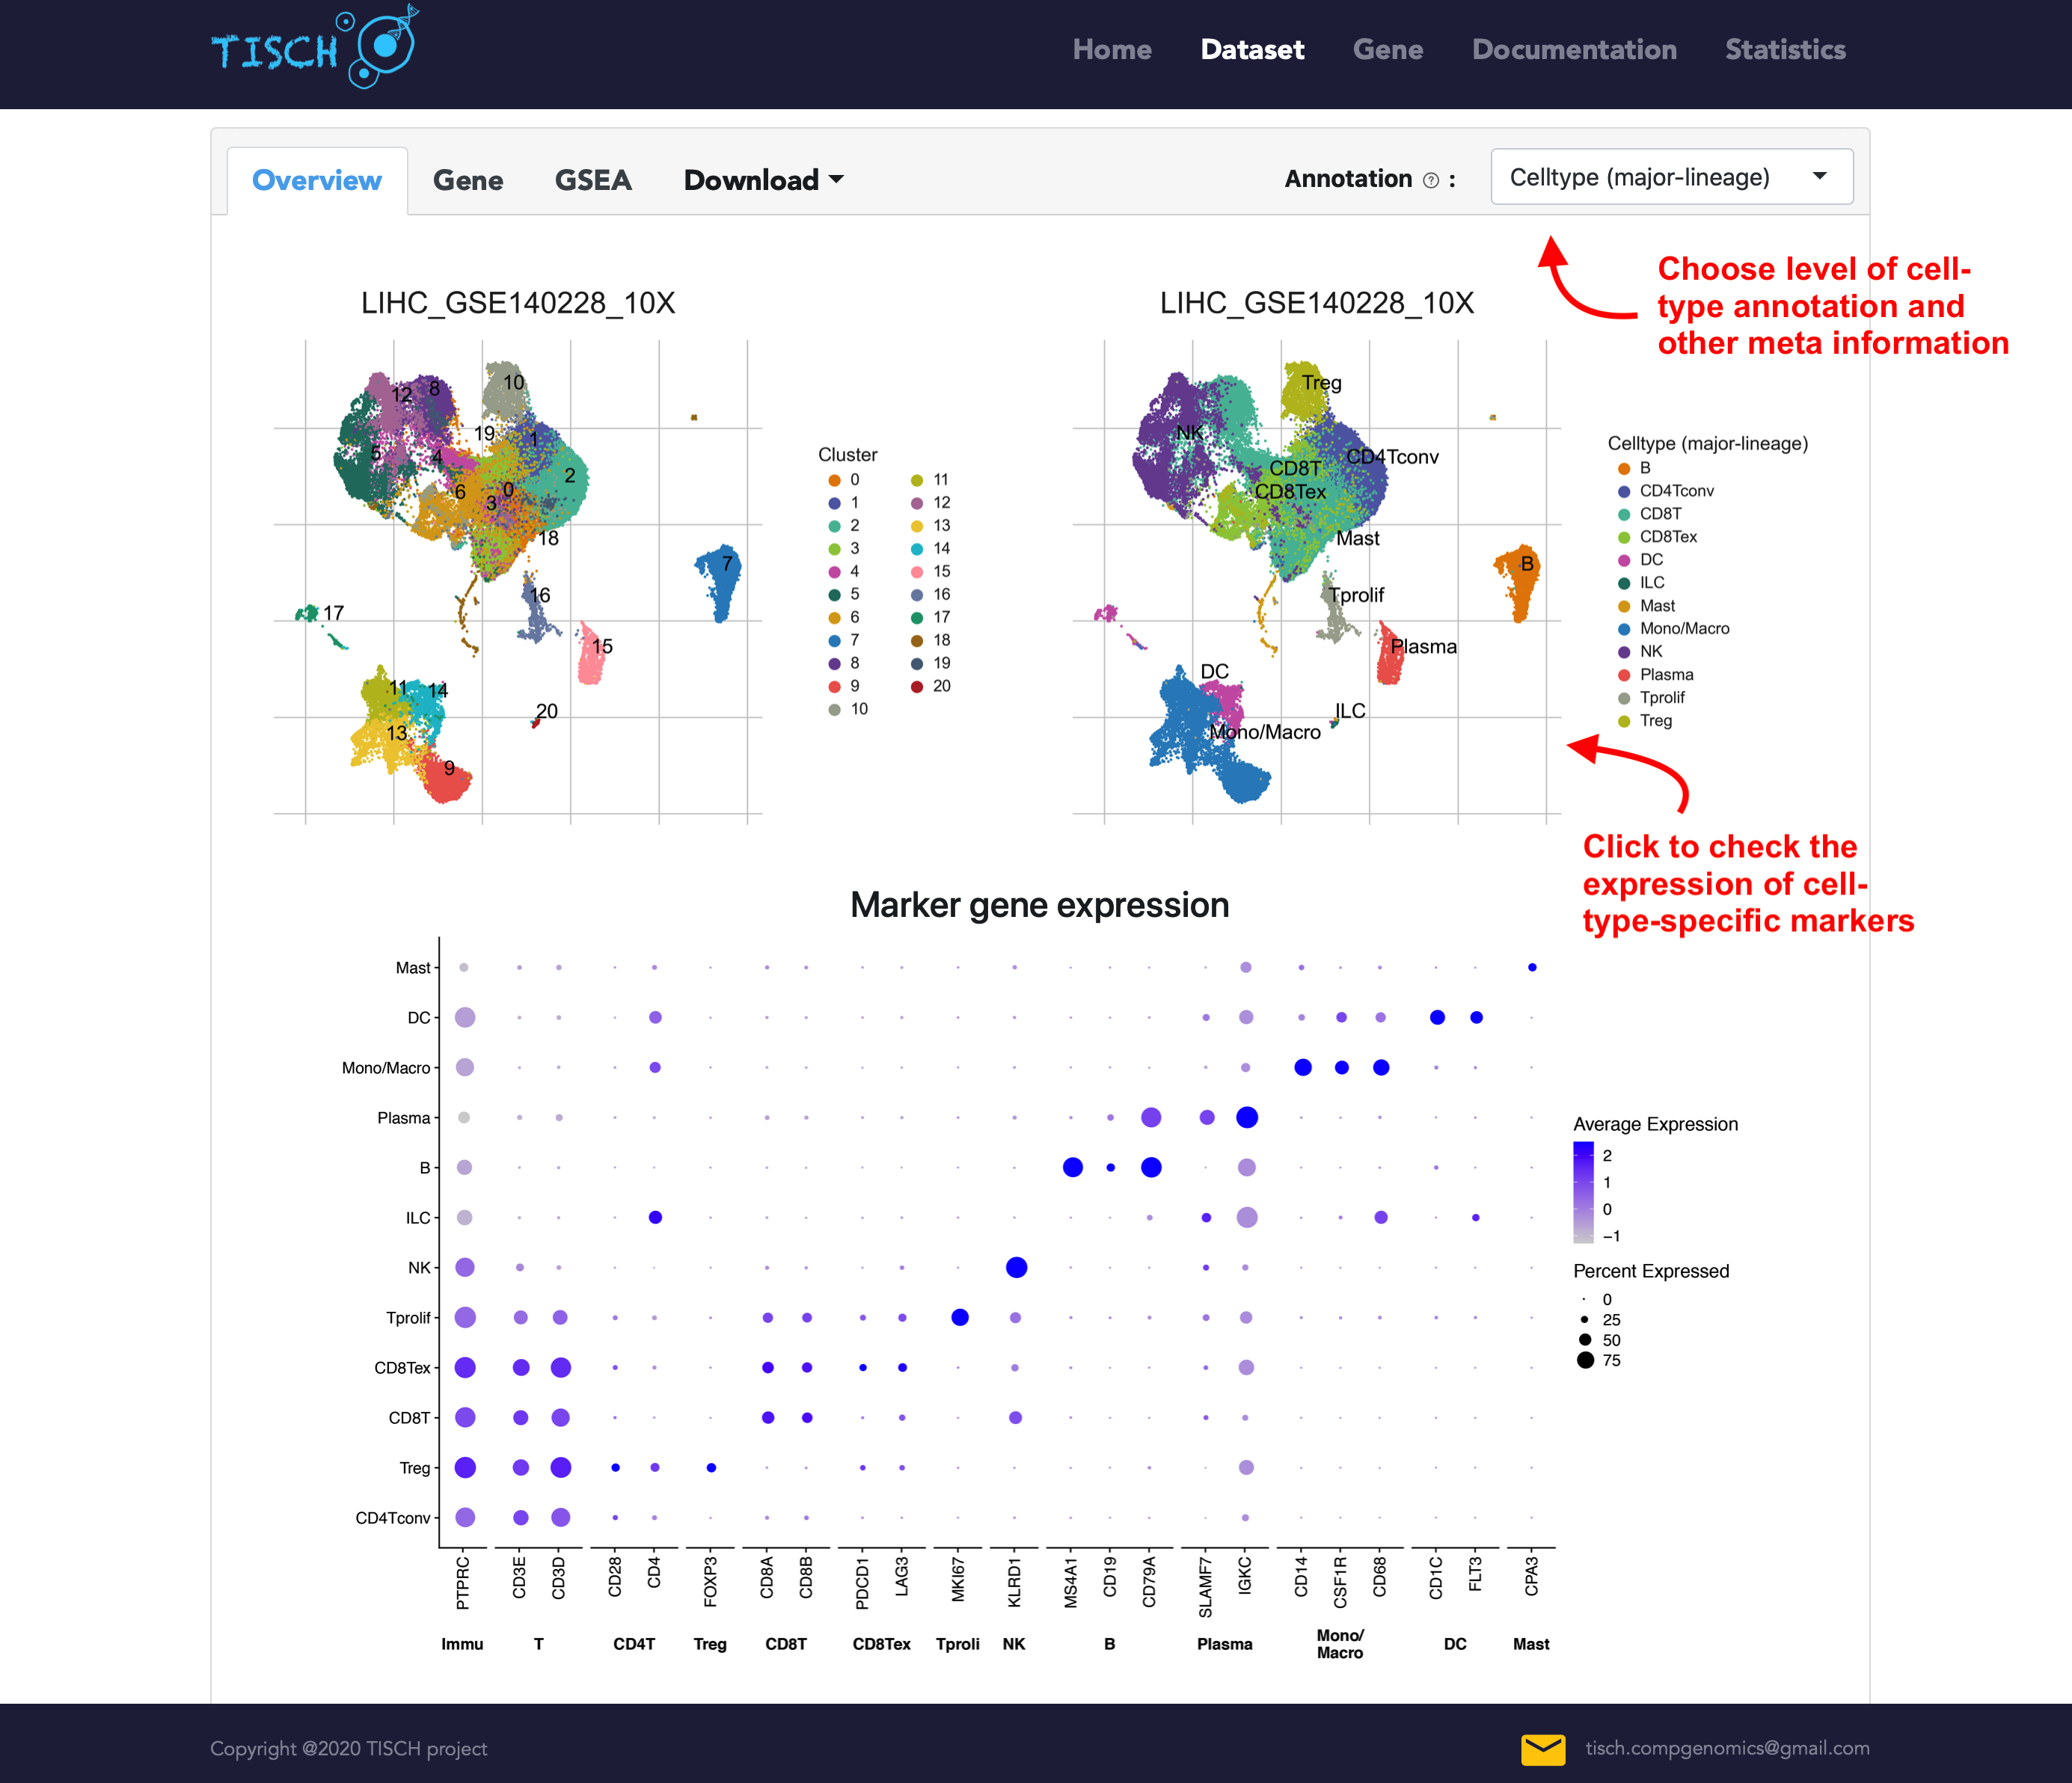
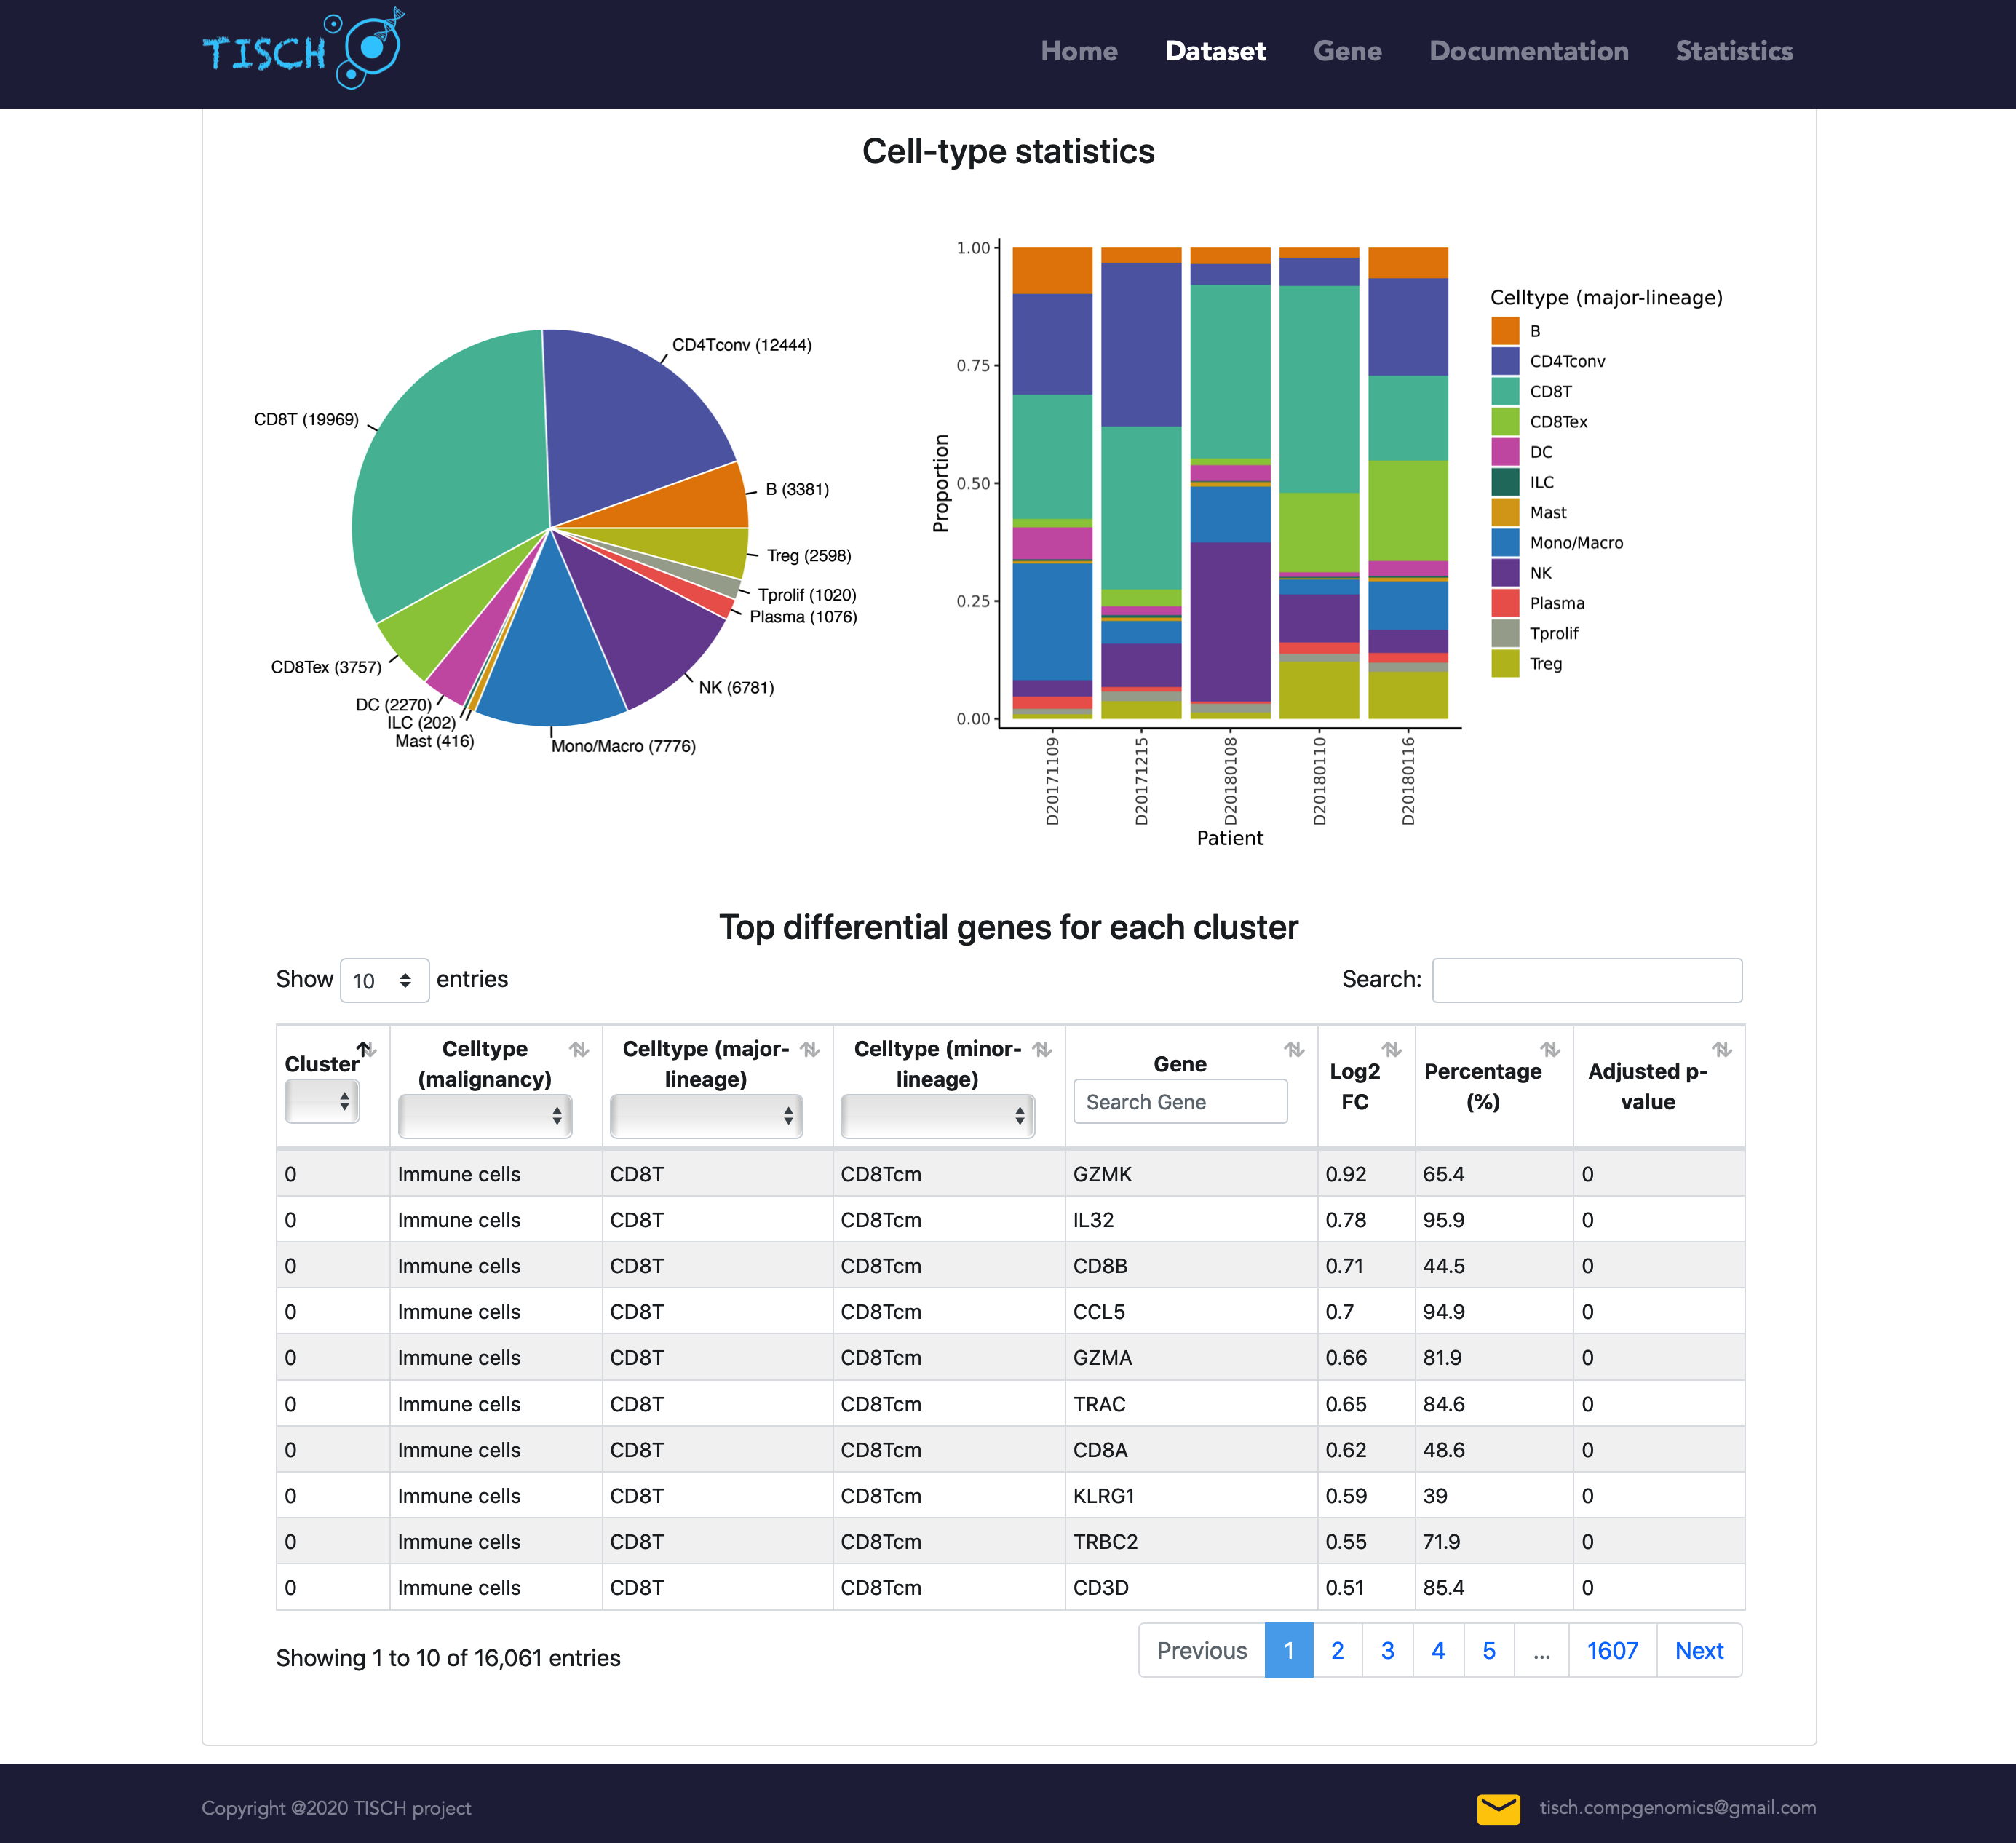
The pie and bar plot show the cell number of each cell type and the cell-type proportion for each patient, respectively. The top differentially expressed genes for each cluster are shown below.
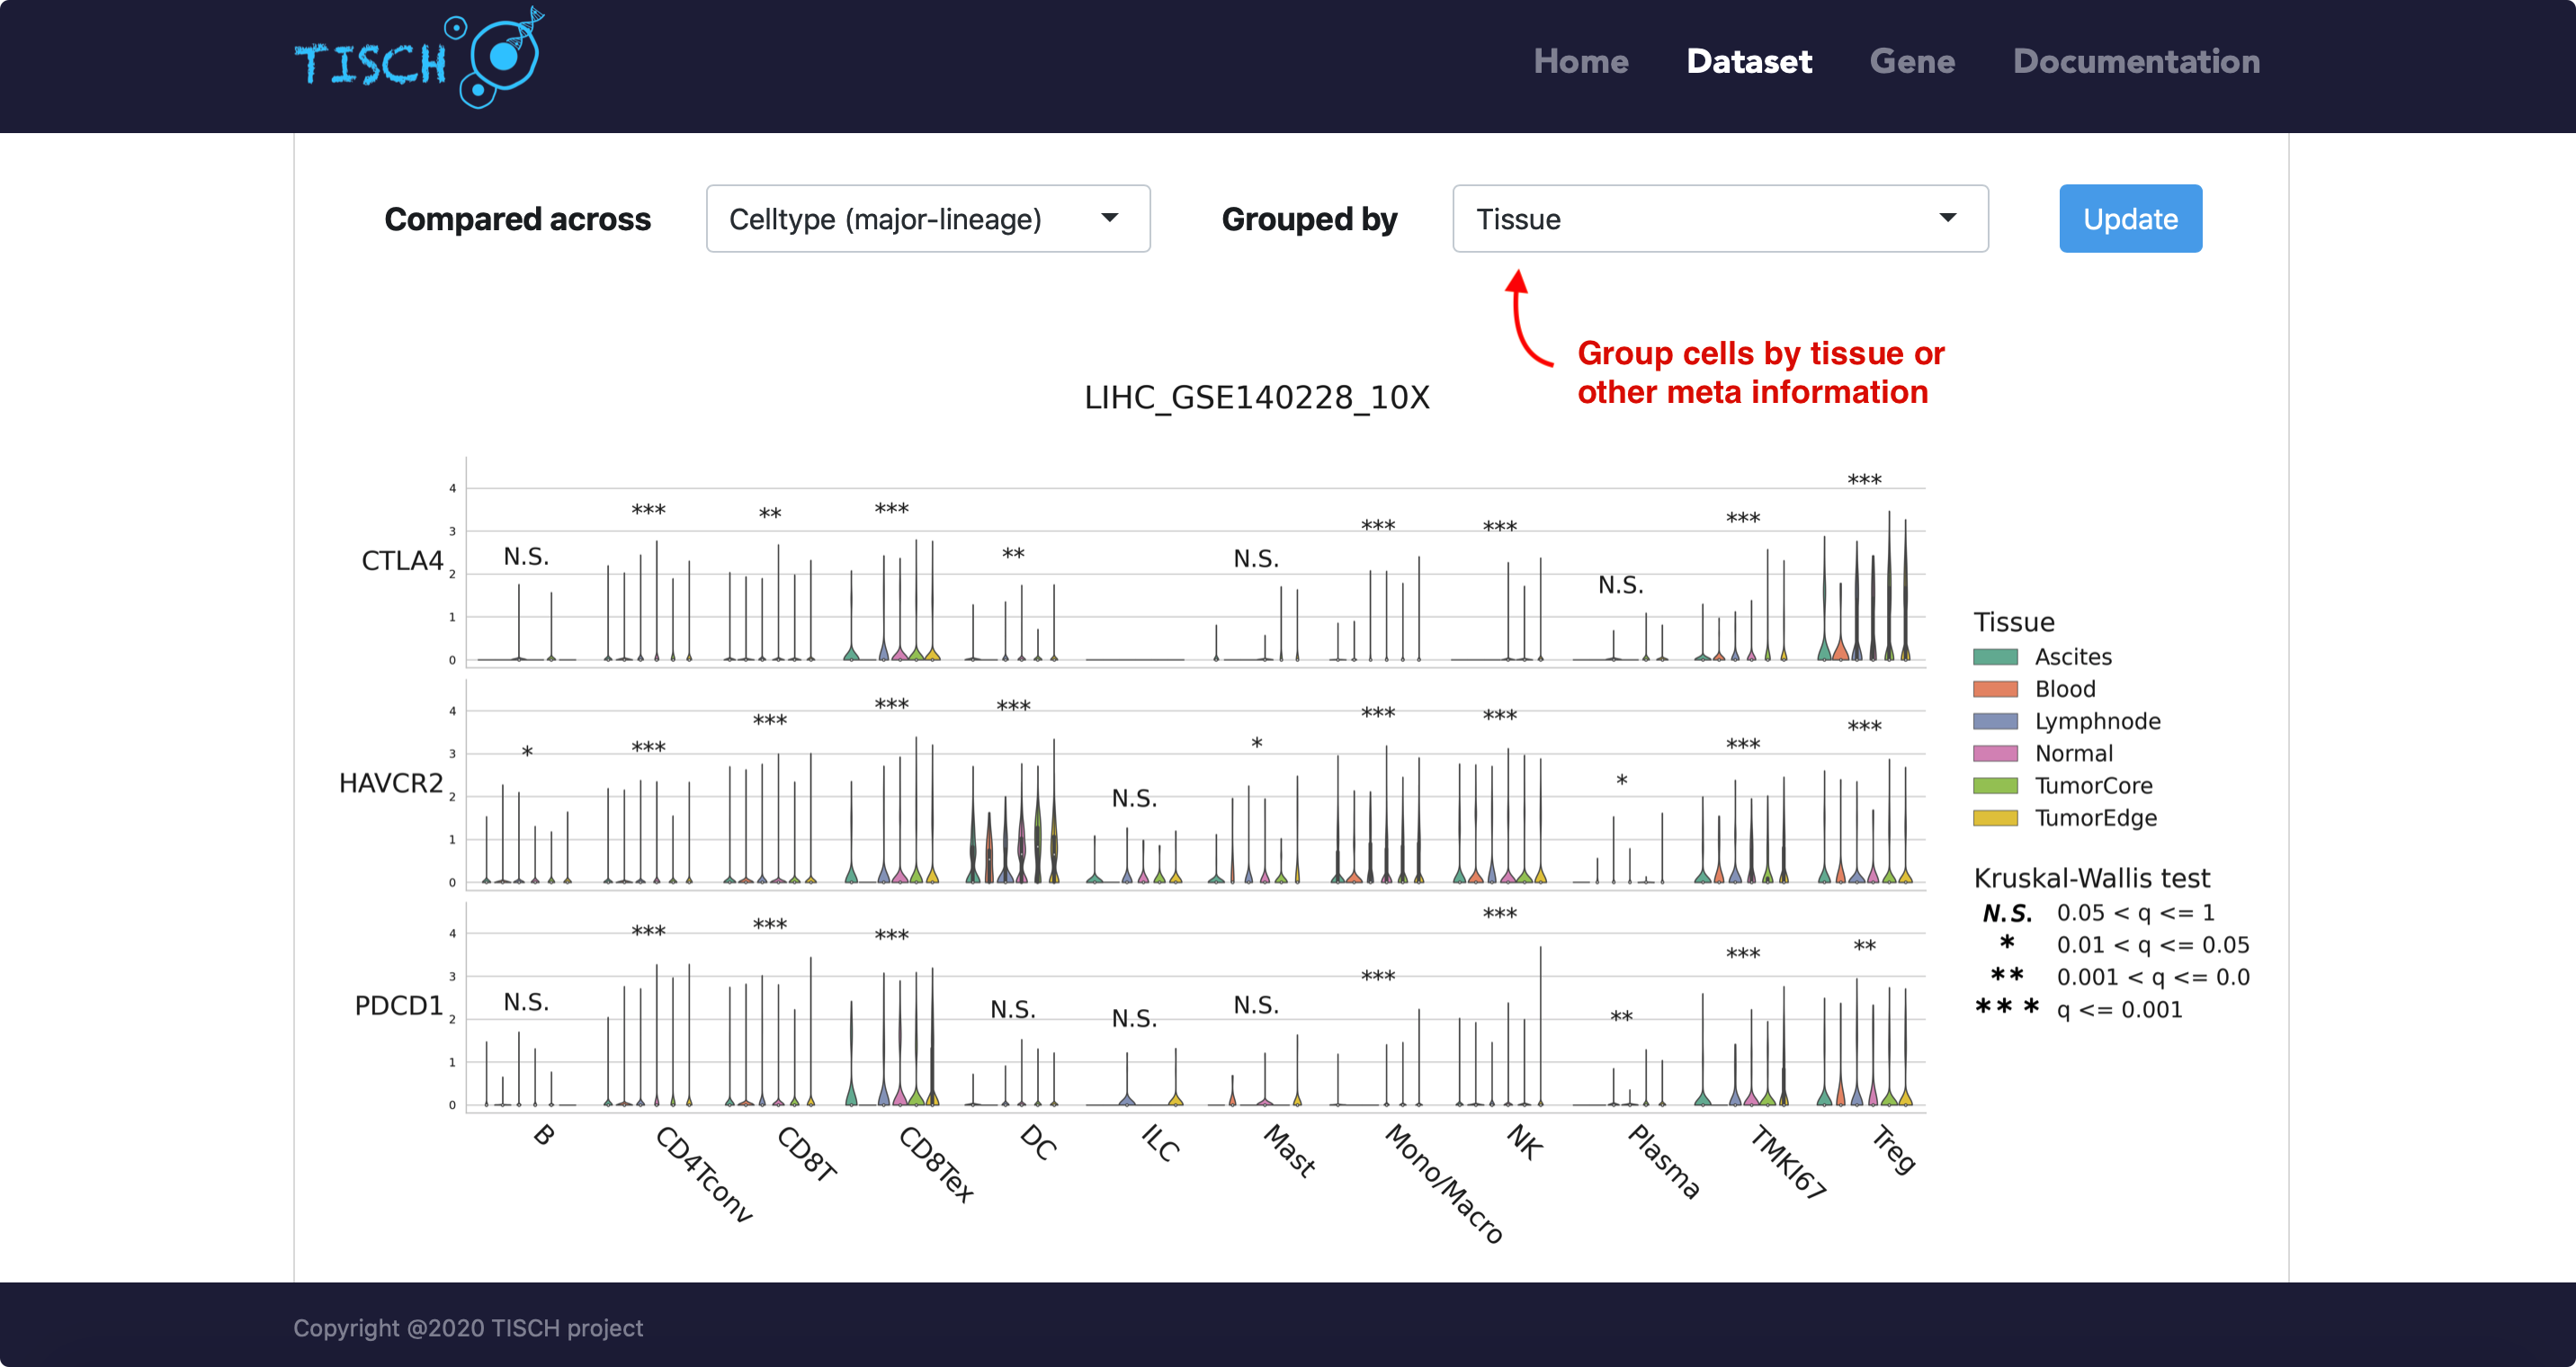
In the gene tab, users can search genes of interest. Besides the UMAP plots, a violin plot will be returned to show the gene expression in different cell types. As in the multiple-dataset page, users can explore the expresion pattern of a gene signature by uploading a line-separated gene list file.
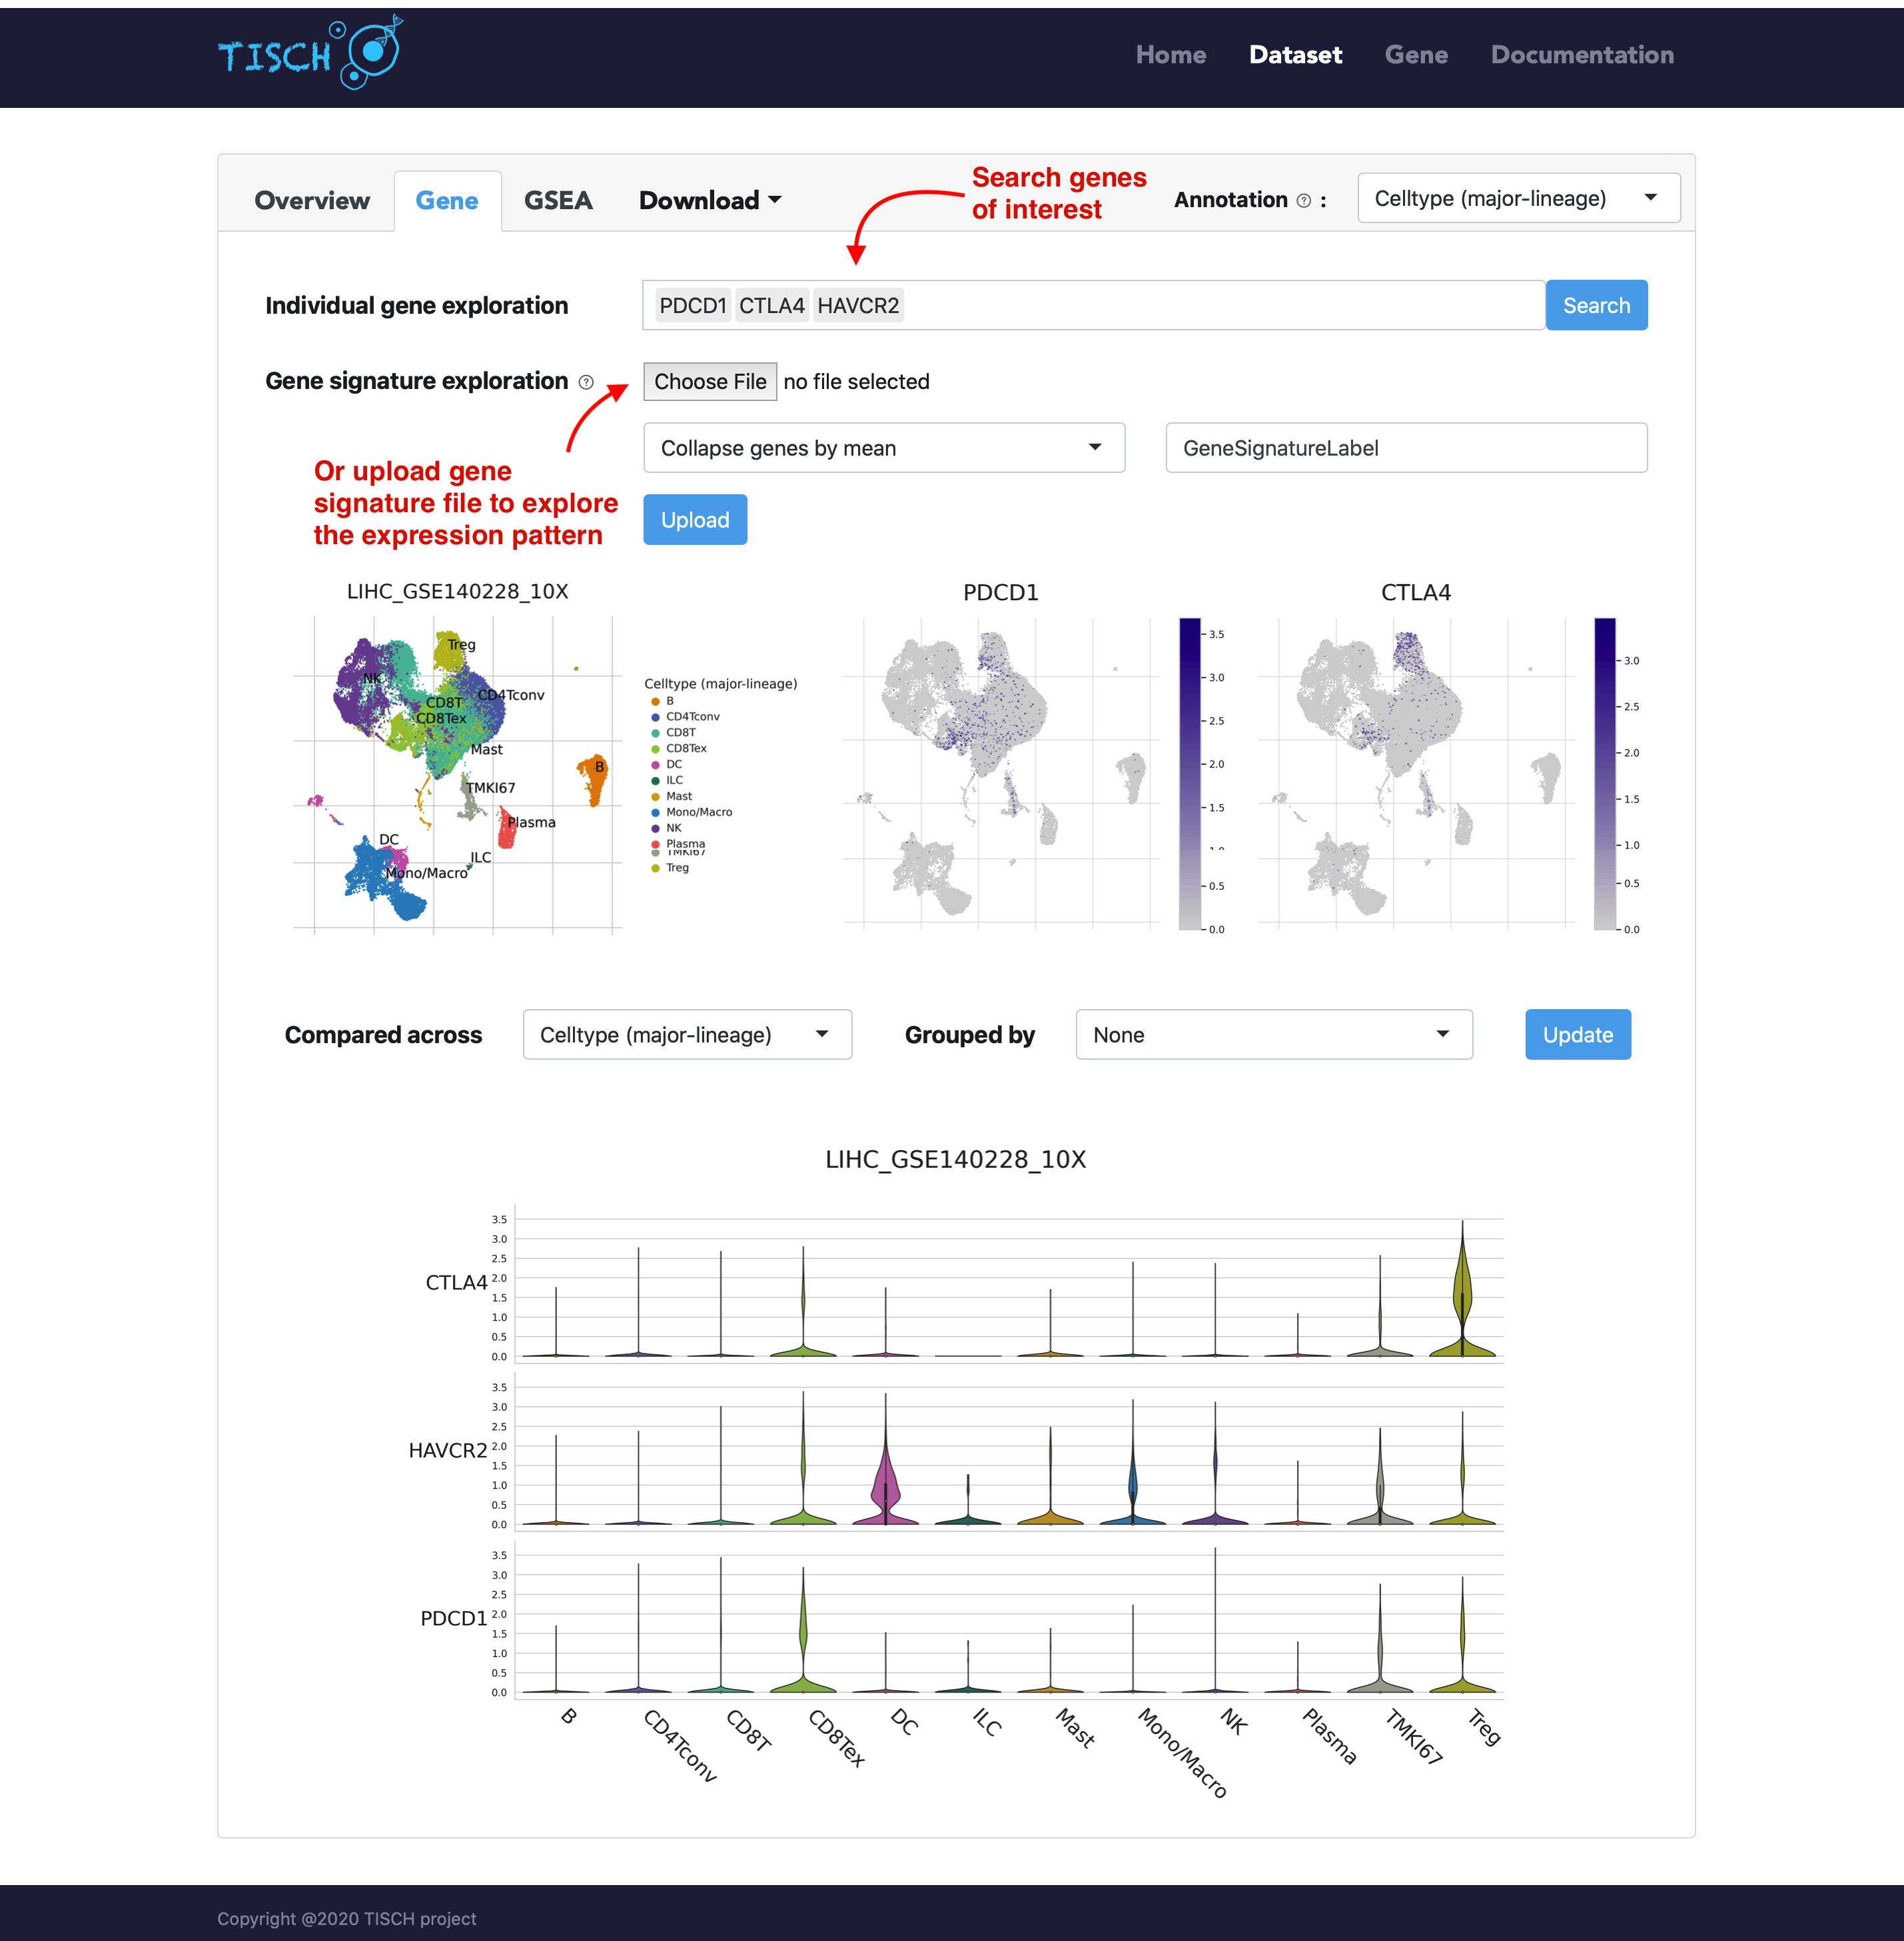
For the violin plot, users can choose to group cells by tissue origin or by other available meta information.
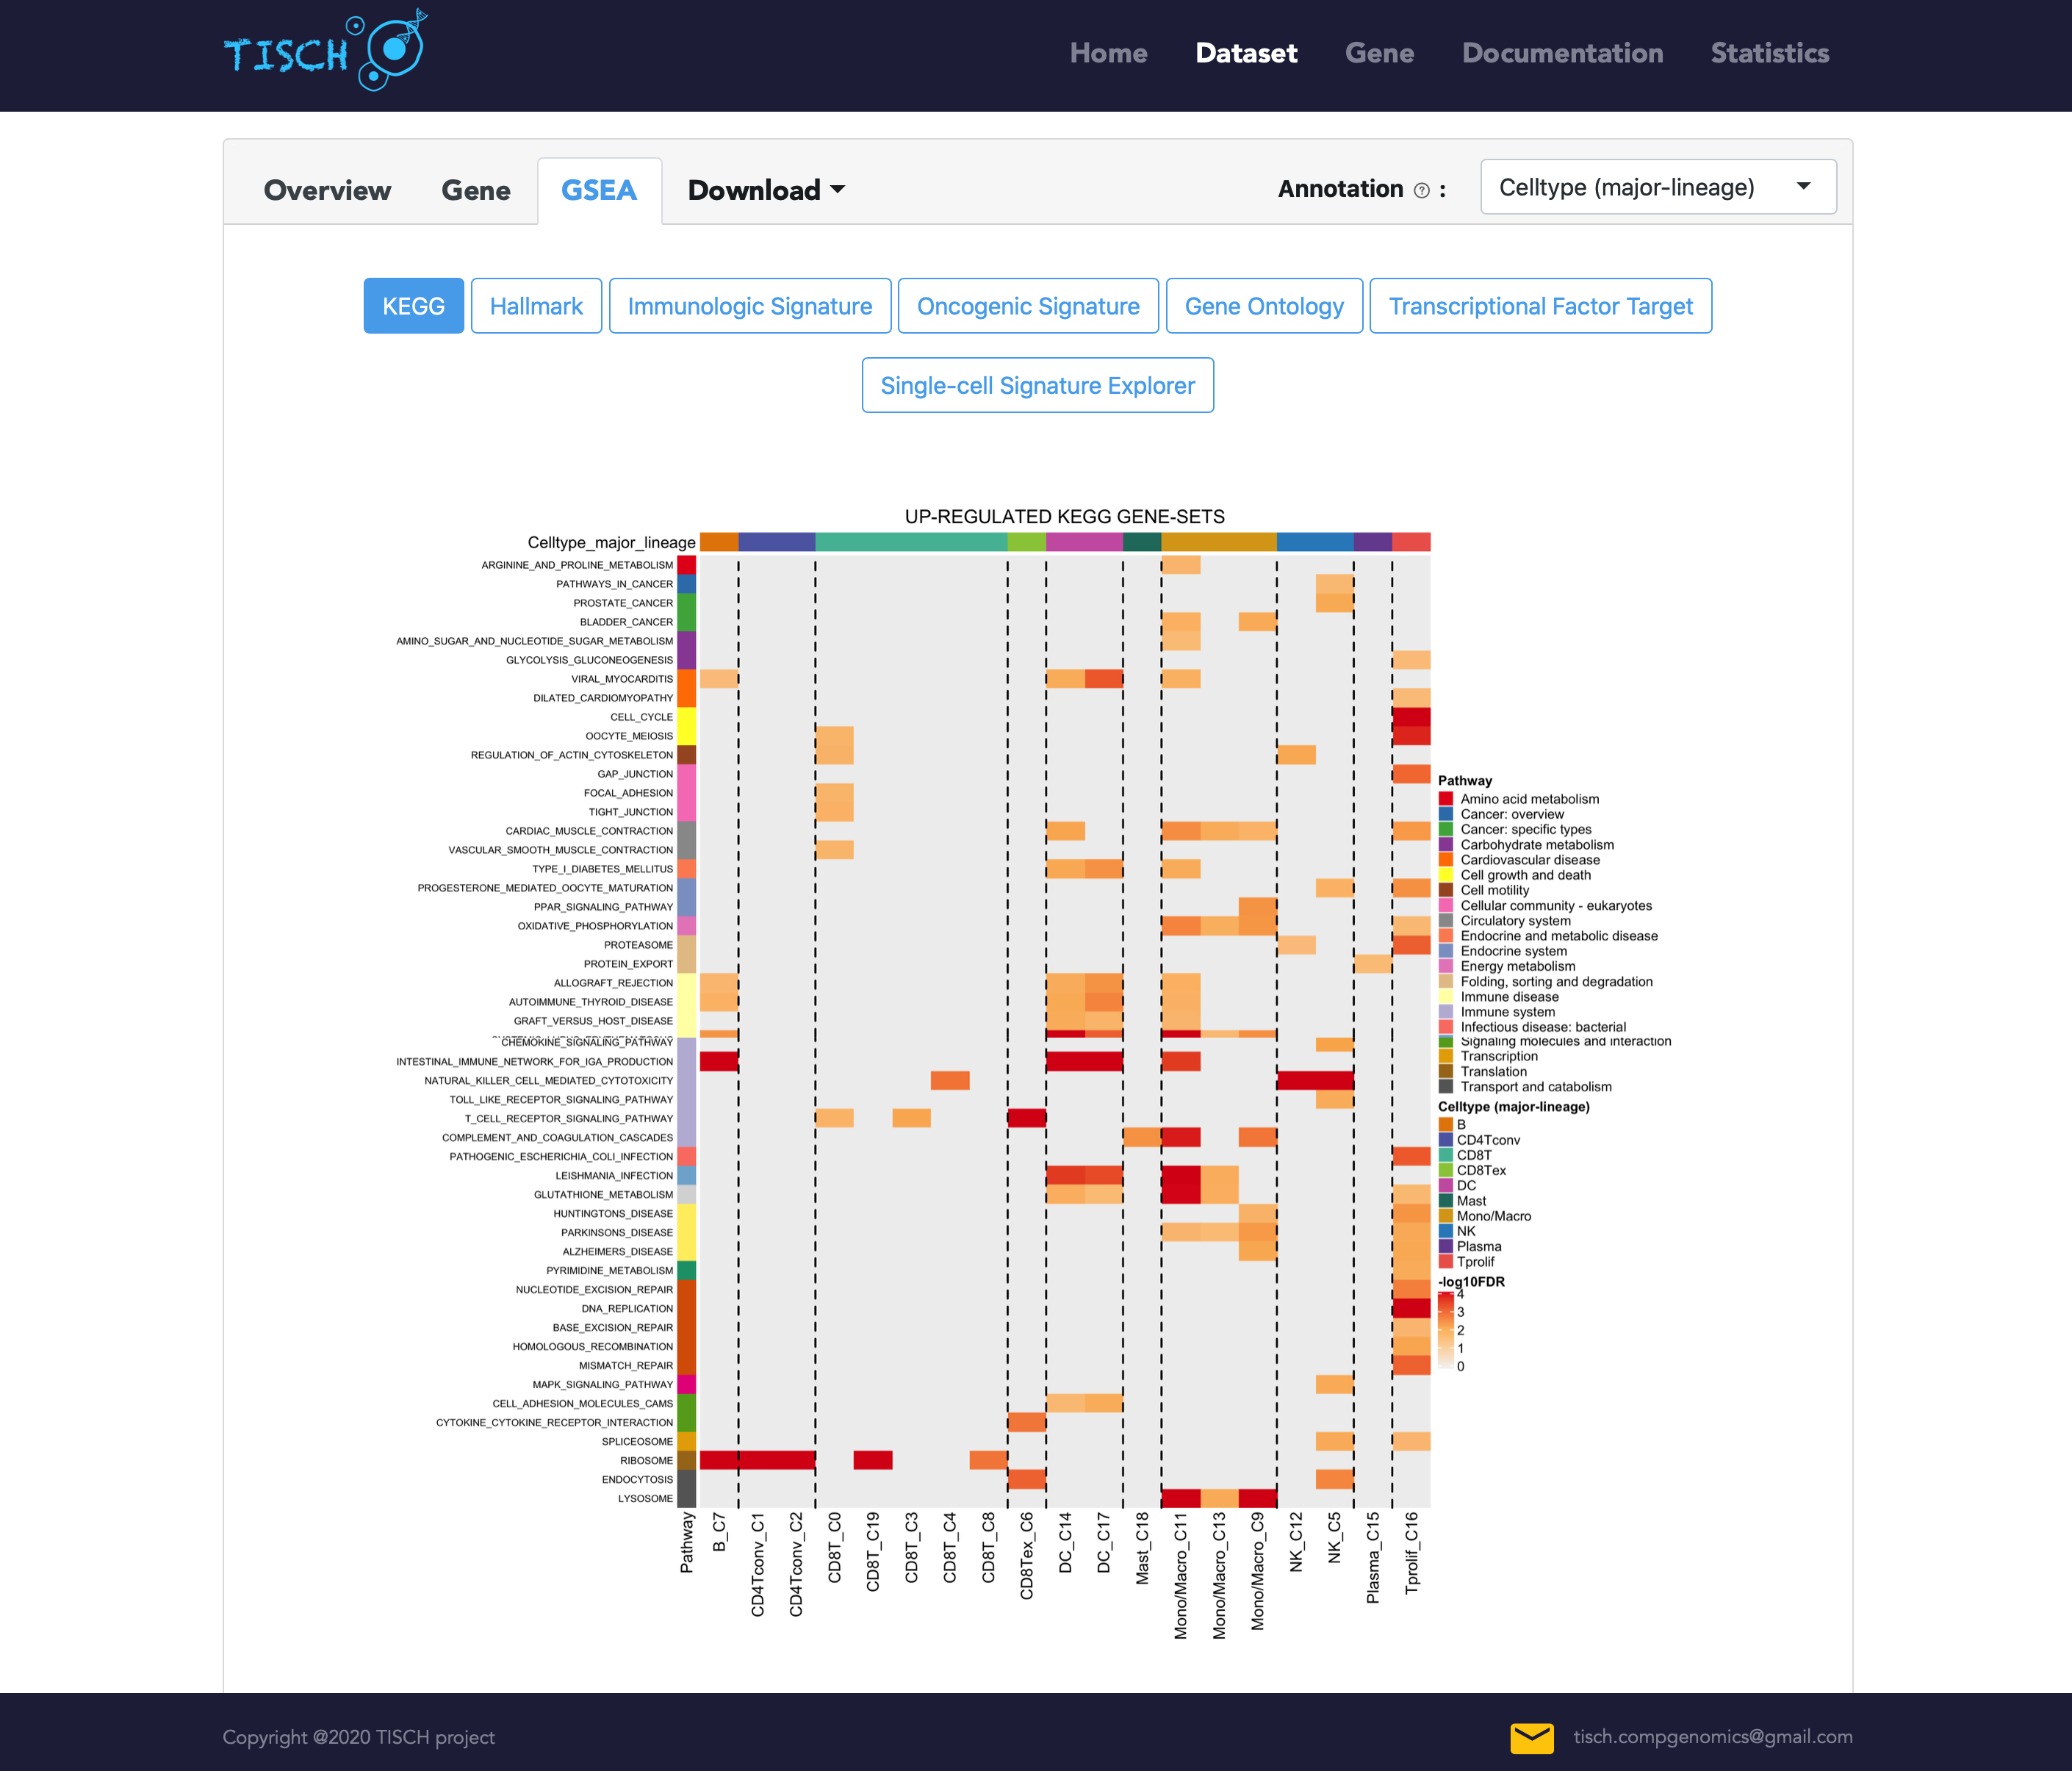
TISCH also provides the gene set enrichment analysis (GSEA) results for each dataset. In the GSEA tab, the pre-calculated GSEA results are available for users to characterize the functional differences between different cell types. We collected 16,626 gene sets from MSigDB, covering KEGG, hallmark, GO, immunological signatures, oncogenic signatures, and transcriptional factor targets. Heatmaps will be shown to display the enriched up- or down-regulated pathways identified based on differential genes in each cluster. For the datasets with treatment information, TISCH also provides GSEA results for comparing functional pathways between different treatment conditions or treatment responses for each cell type.
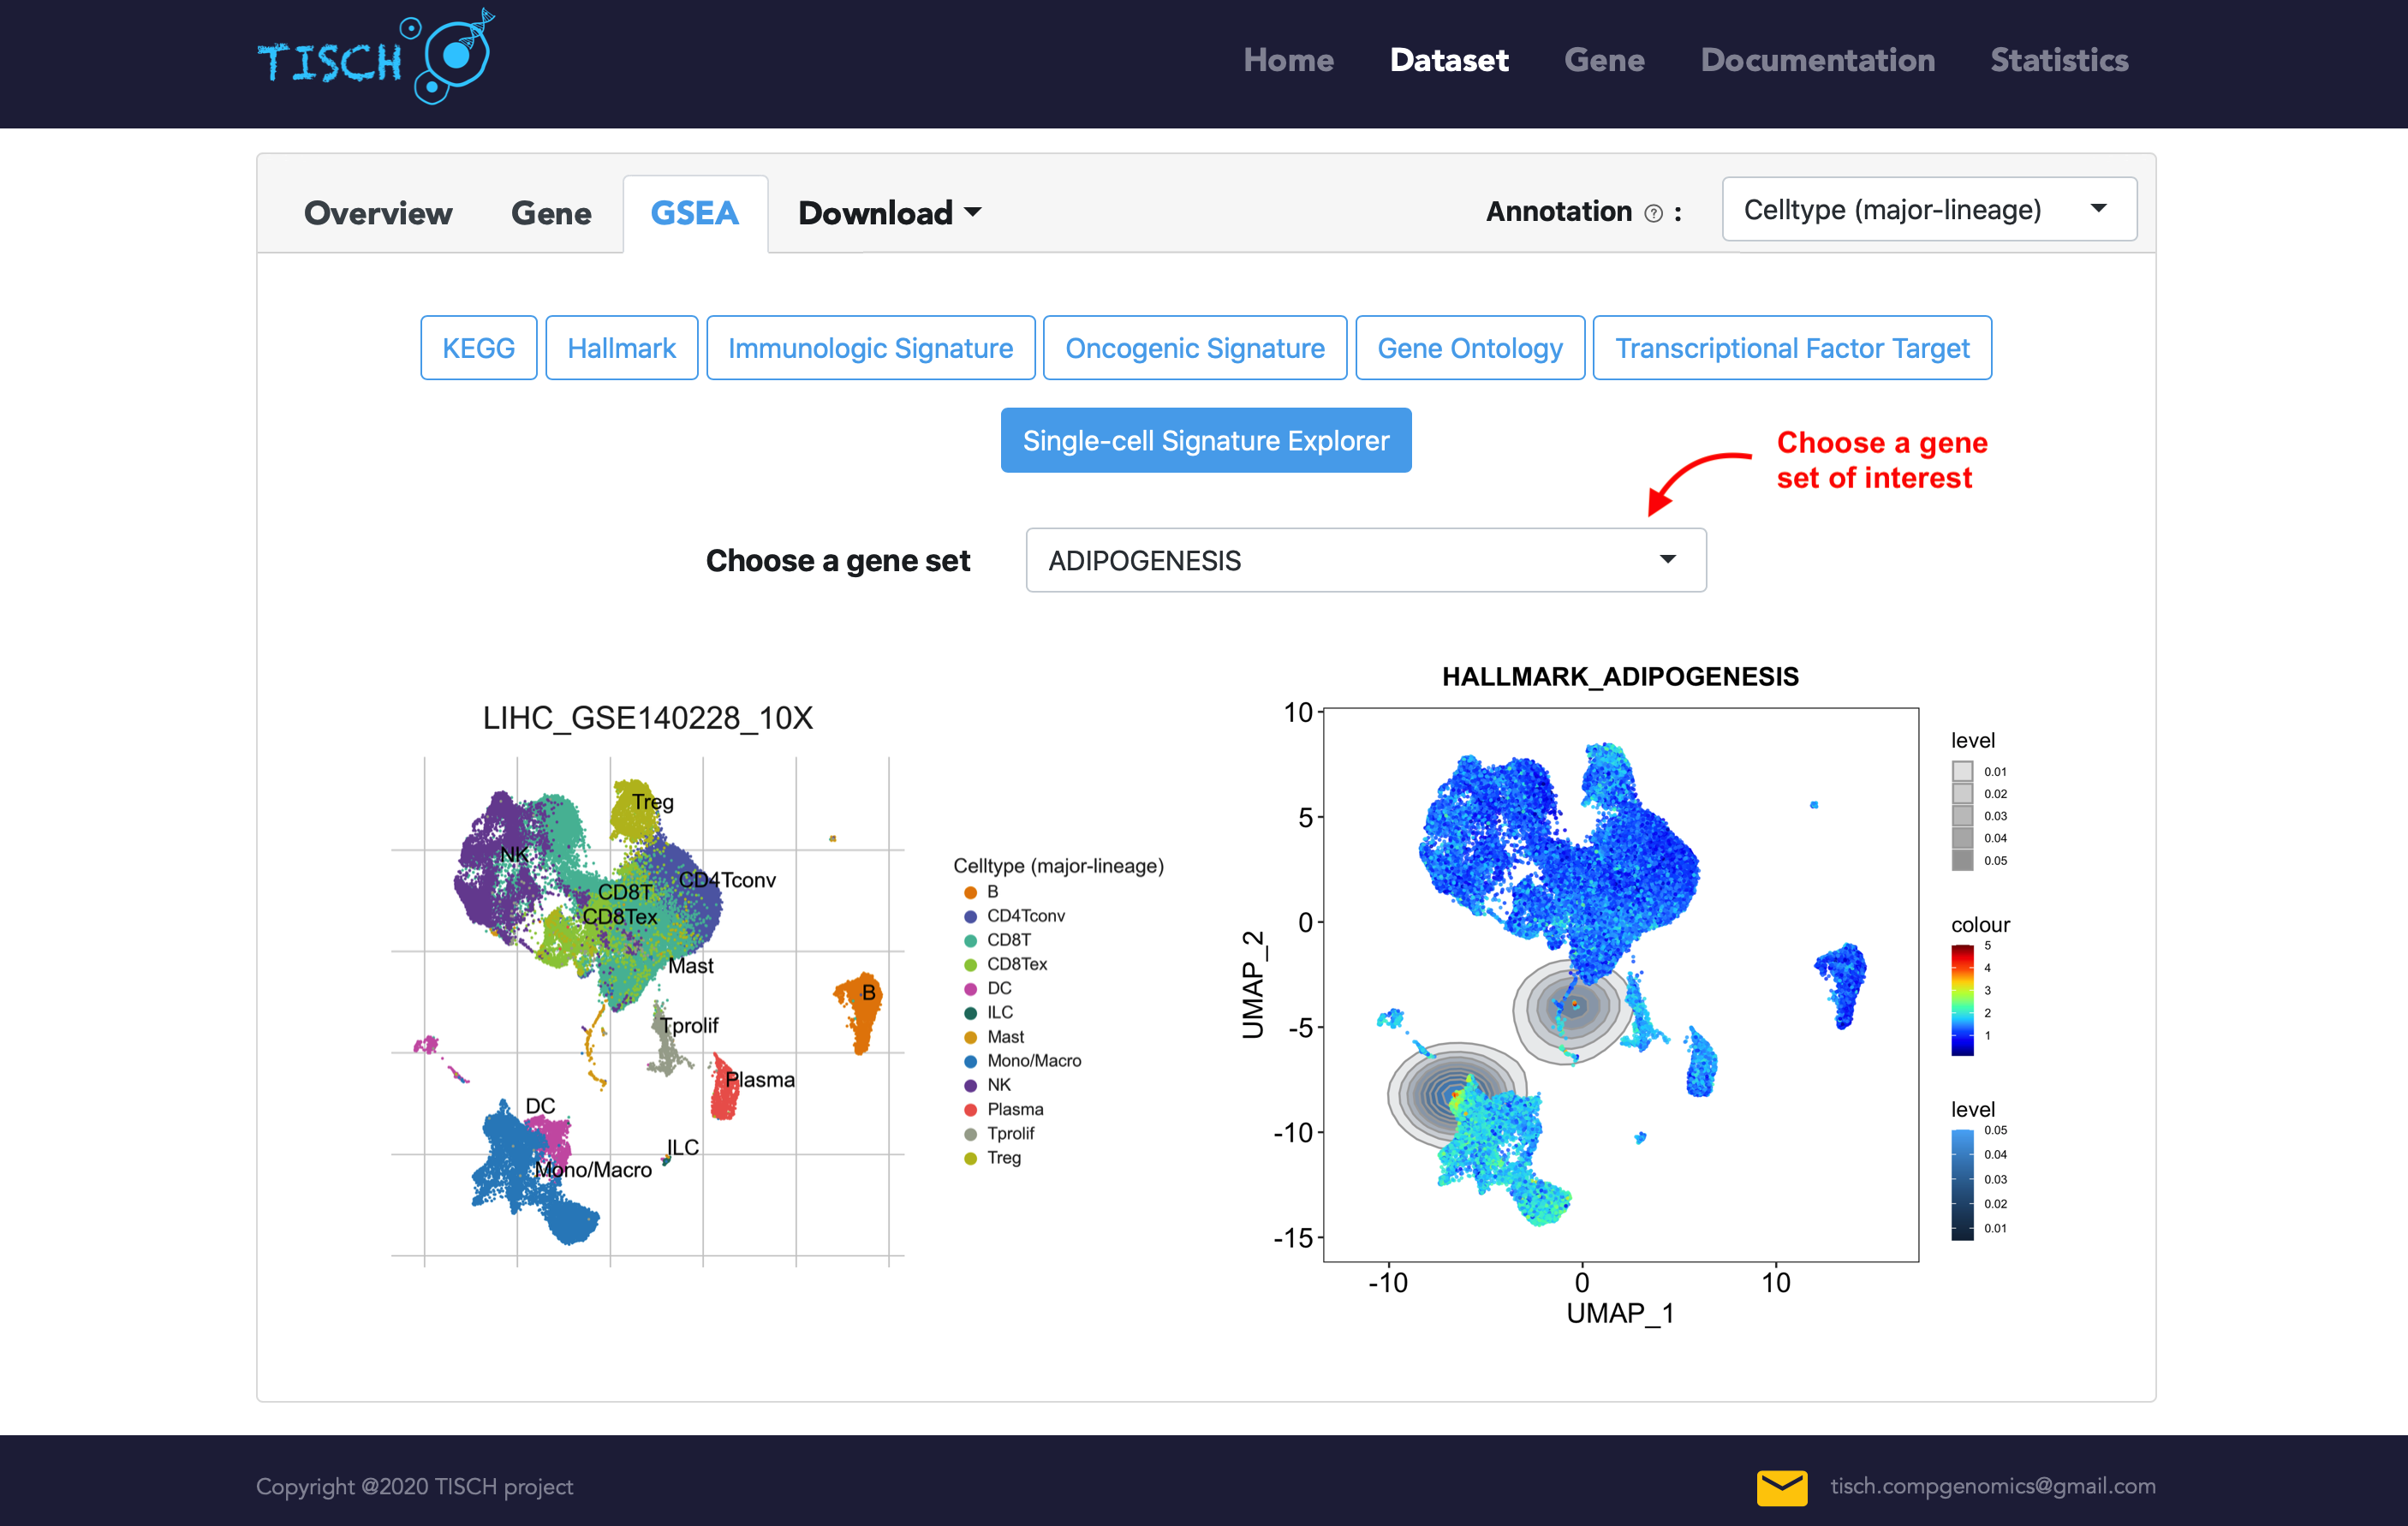
In addition, we integrated Single-Cell Signature Explorer (38) for computing GSEA pathway enrichment score at single-cell resolution. Users can optionally select a hallmark pathway of interest to visualize the single-cell-specific enrichment.
Users can download the gene expresion matrix averaged by cell types and differential gene table for further exploration.
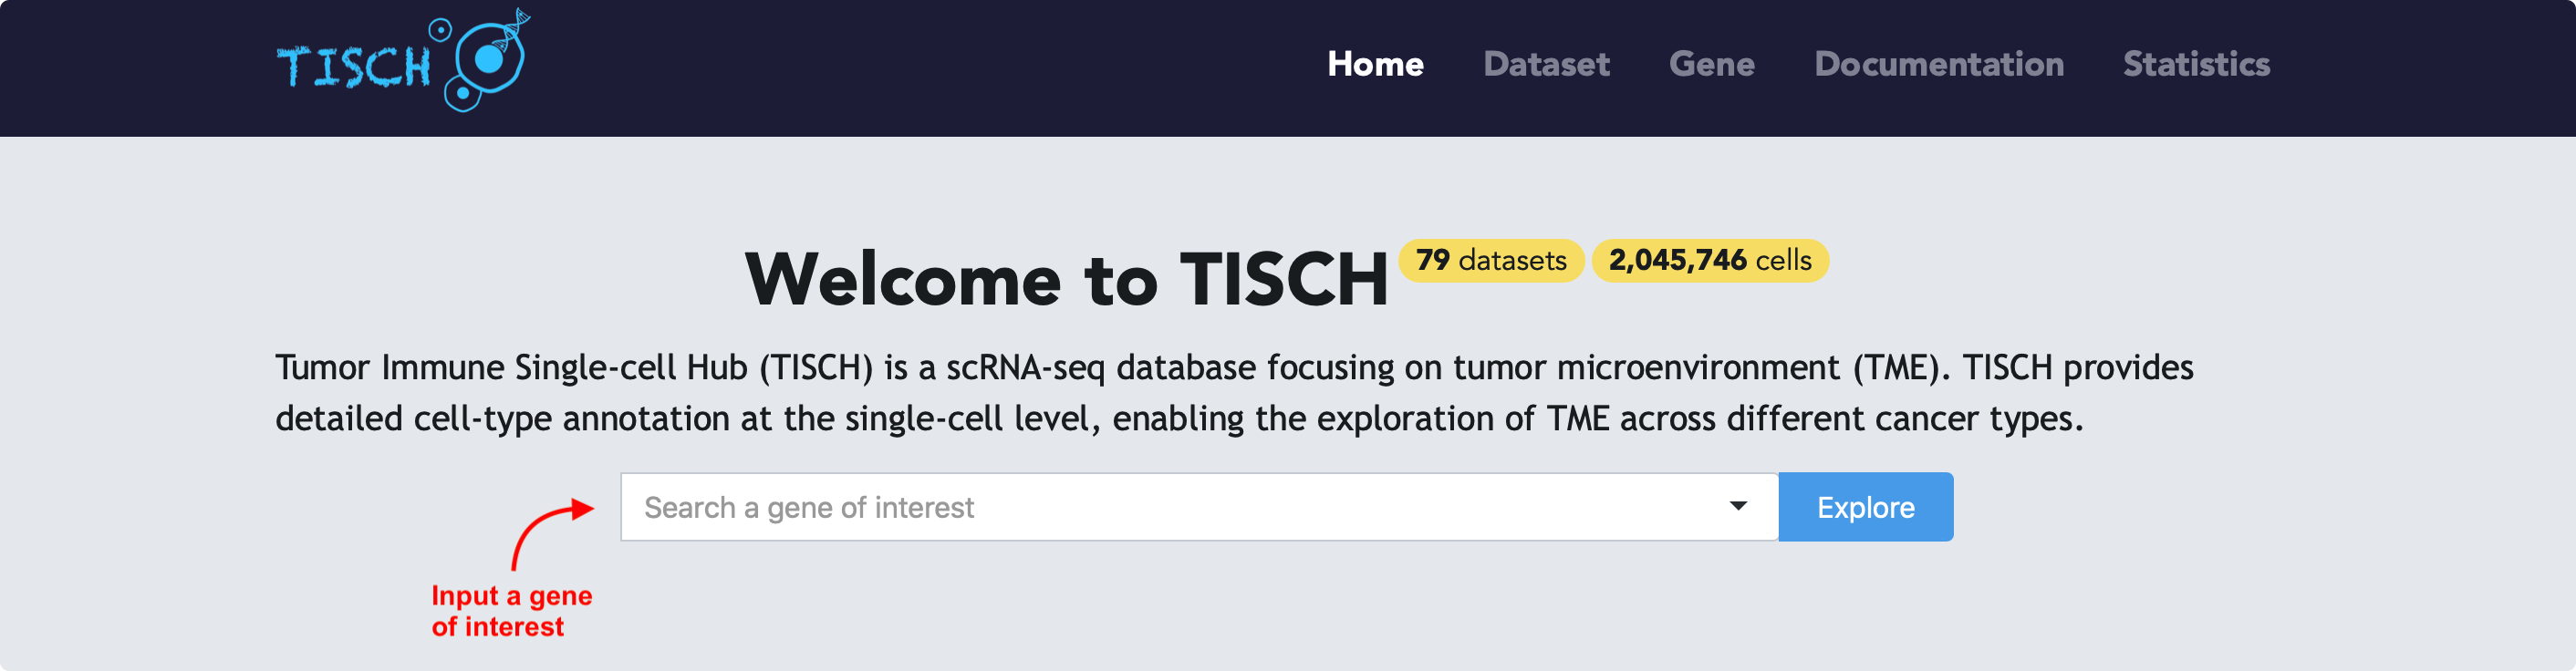
Starting with a gene of interest
If users are interested in one gene, they can input the gene in the search bar and click the Explore button, then the page will be re-directed to gene page.
By default, the expression of the given gene will be visualized using all datasets with the gene expressed. Users can select the cancer types of interest to further filter the datasets.
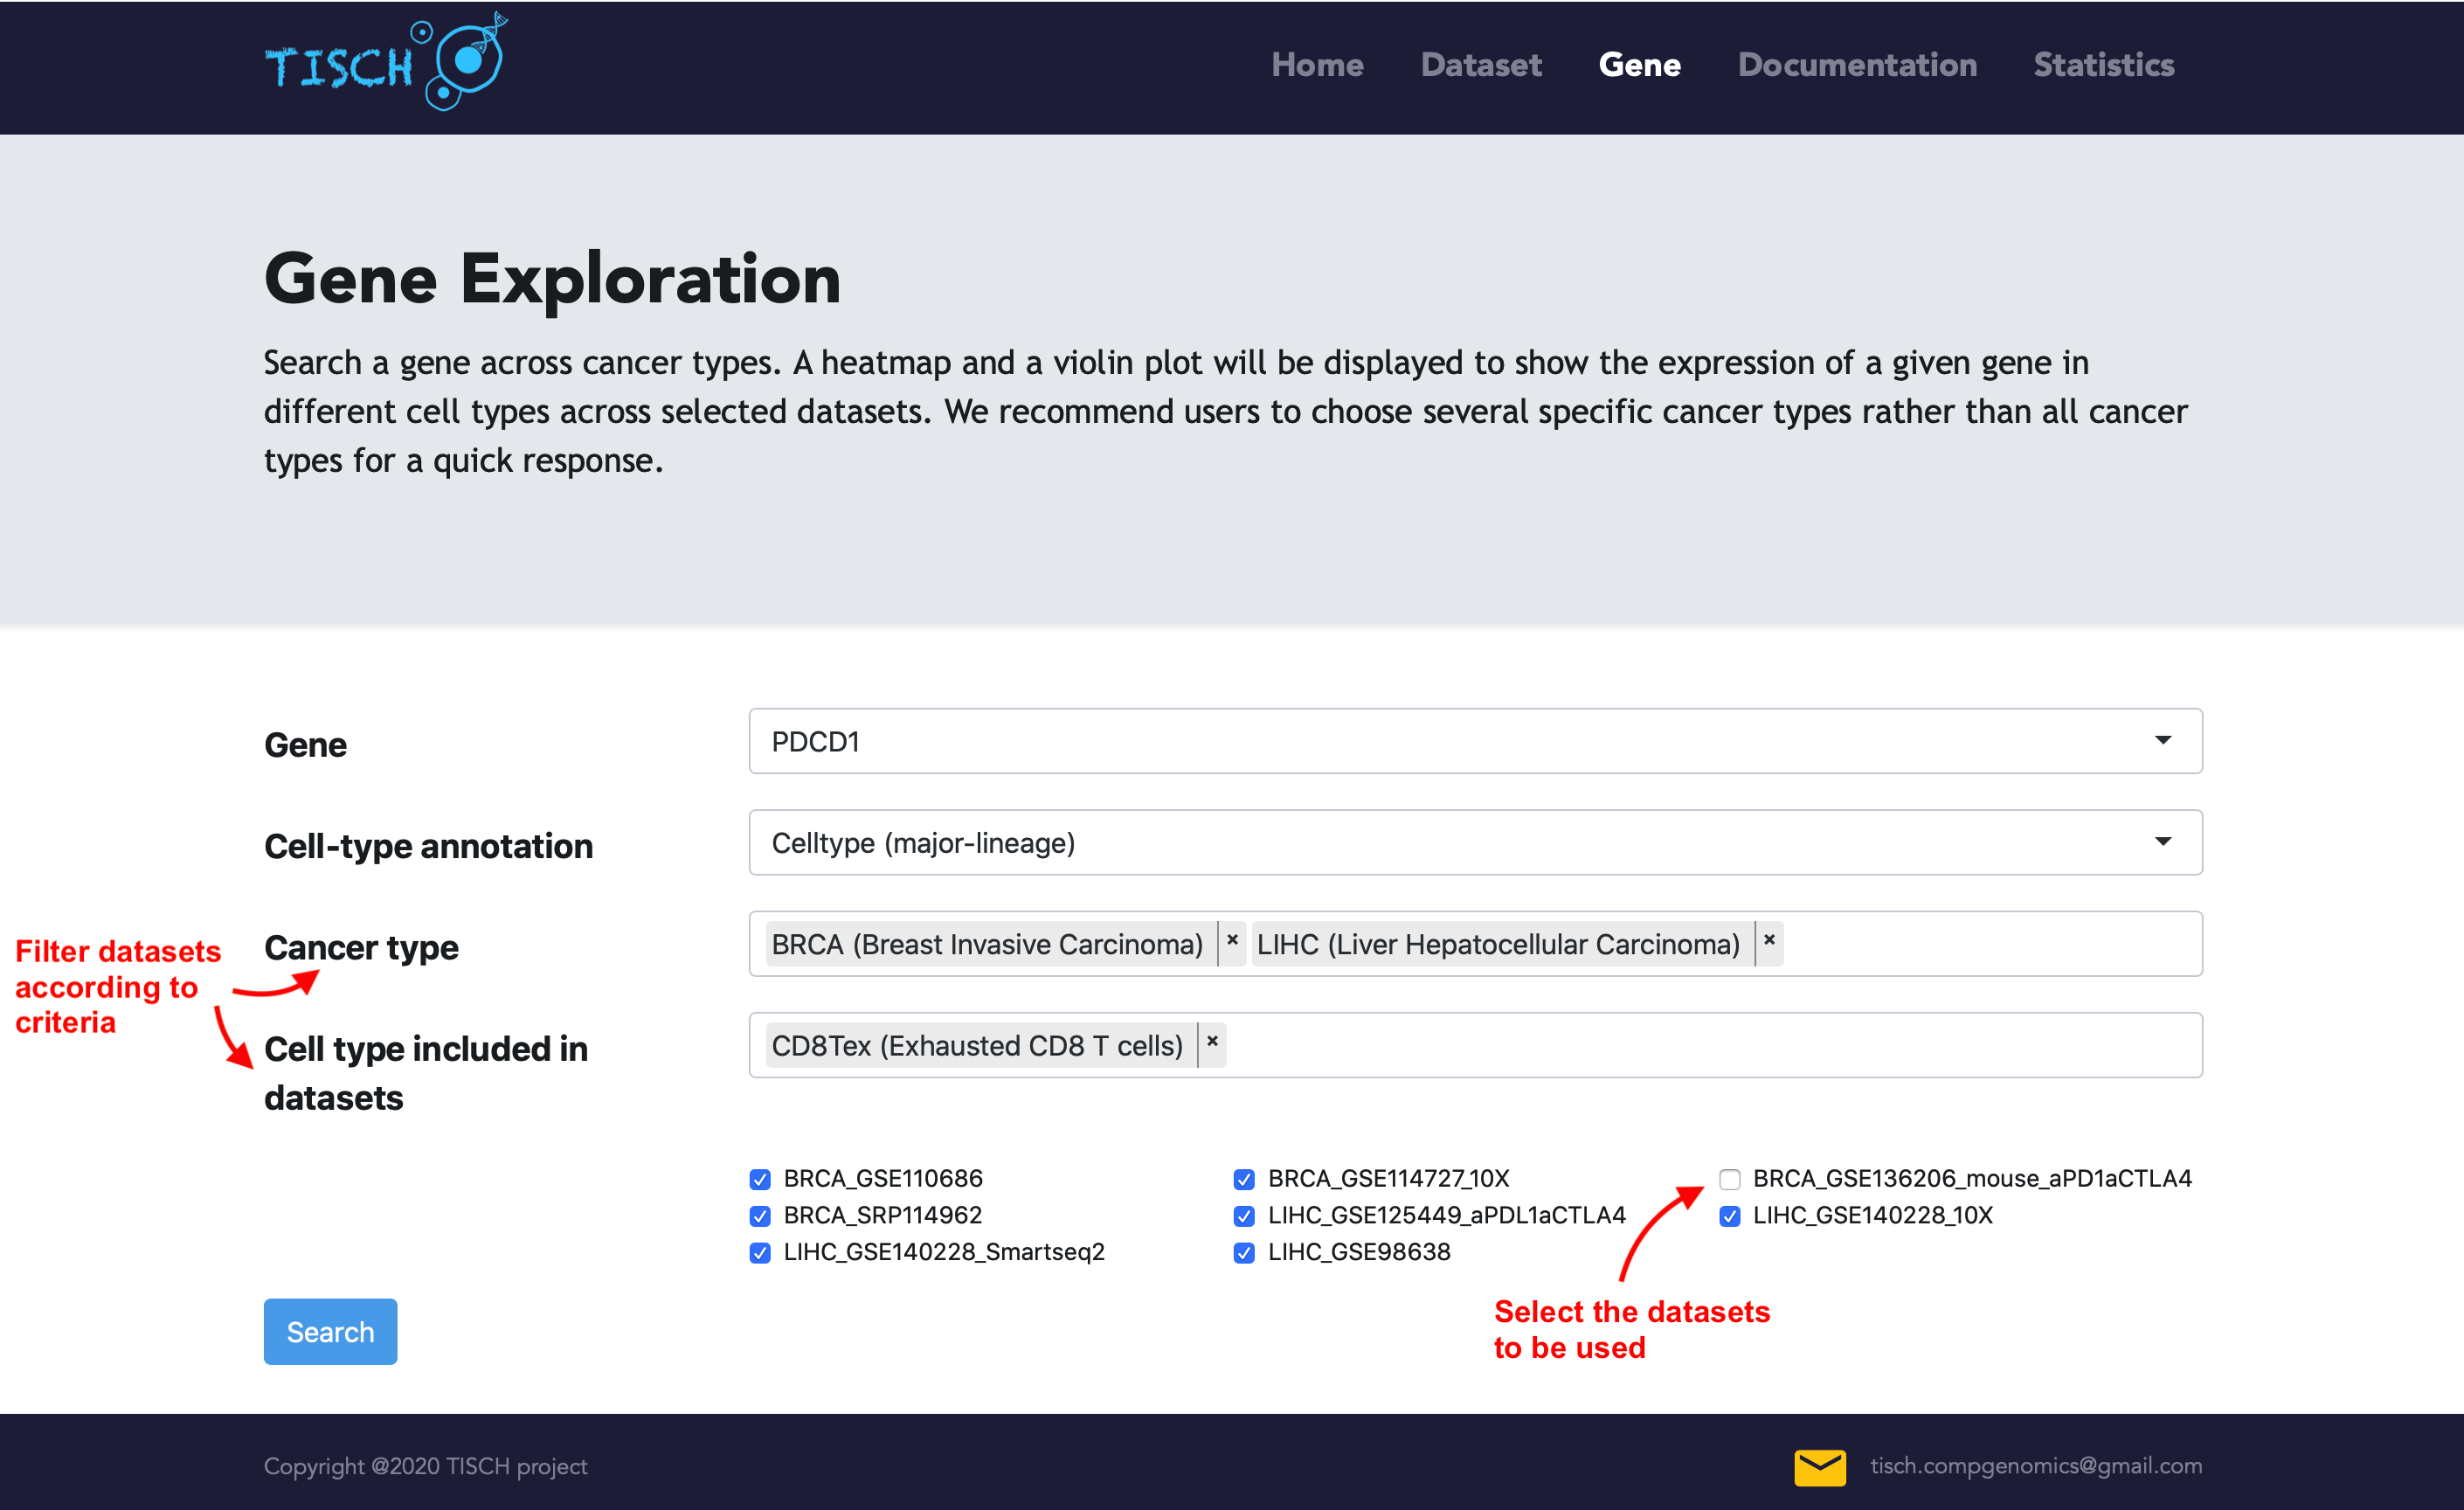
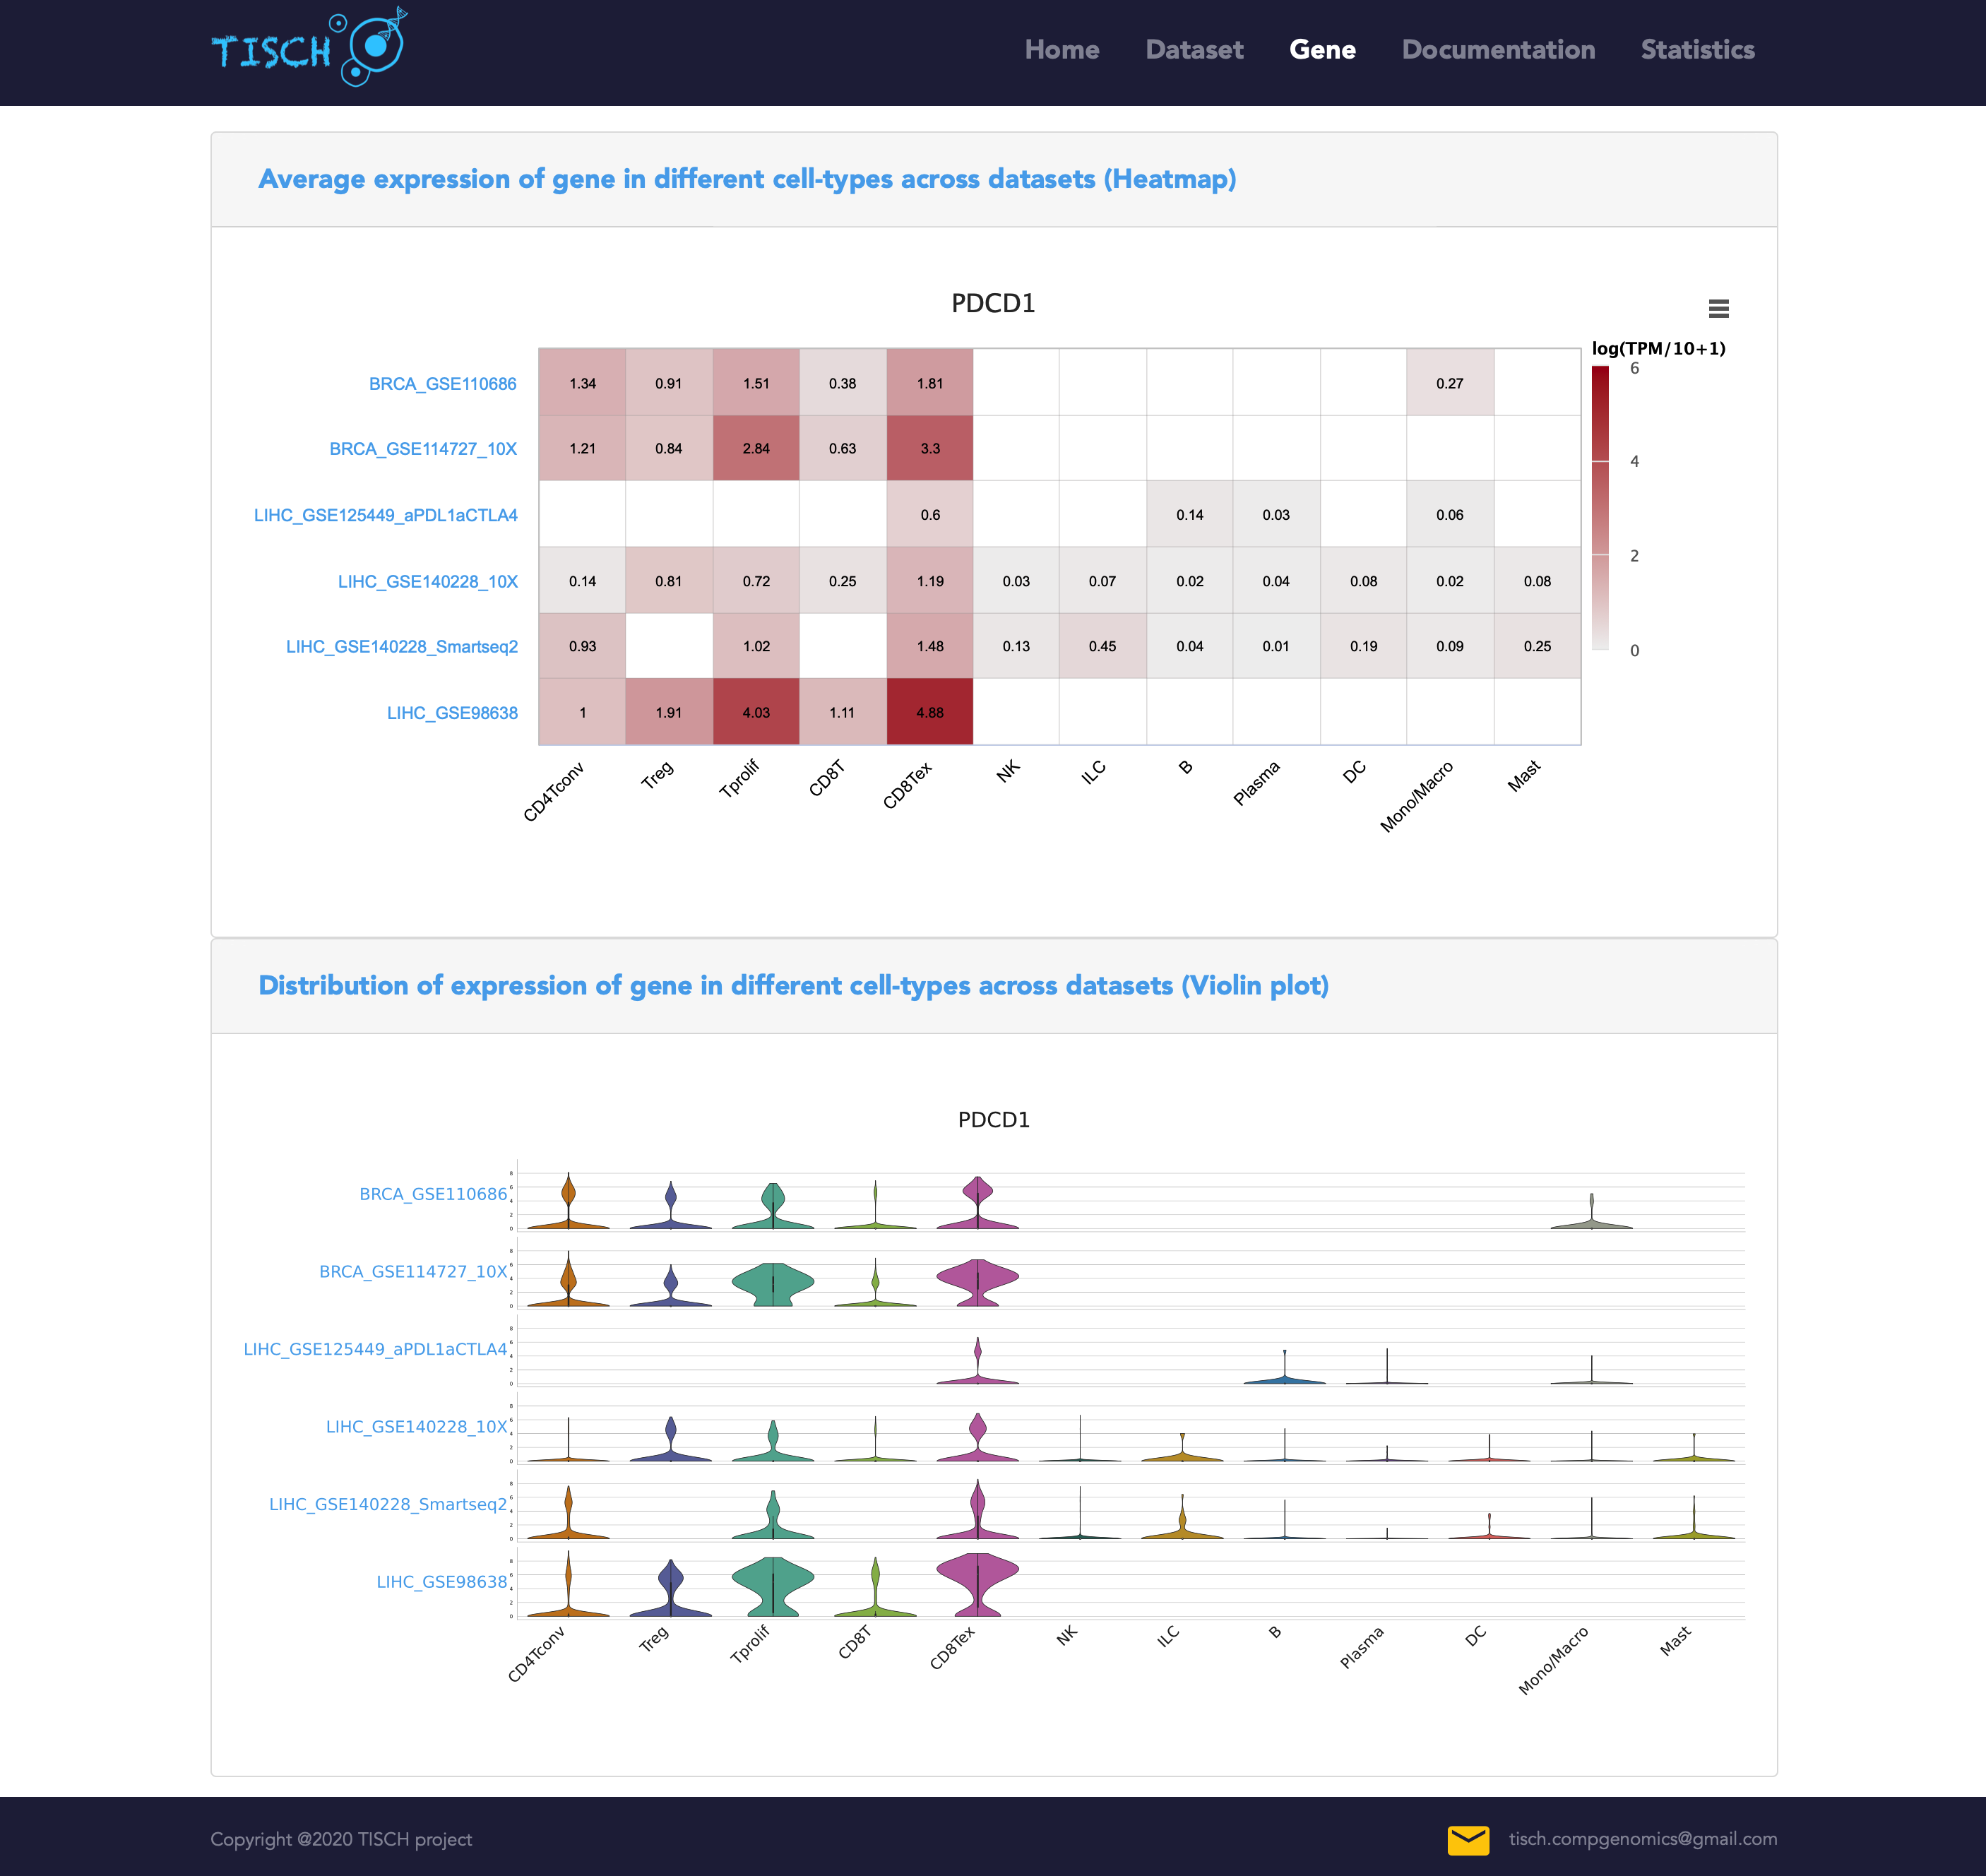
After clicking the Search button, a heatmap and a violin plot will be displayed to reflect the gene expression (logTPM) in different cell types across all the selected datasets.
Abbreviations
Cancer type
| Abbreviation | Cancer type |
|---|---|
| AEL | Acute Erythroid Leukemia |
| ALL | Acute Lymphoblastic Leukemia |
| AML | Acute Myeloid Leukemia |
| BCC | Basal Cell Carcinoma |
| BLCA | Bladder Urothelial Carcinoma |
| BRCA | Breast Invasive Carcinoma |
| CHOL | Cholangiocarcinoma |
| CRC | Colorectal Cancer |
| CLL | Chronic Lymphocytic Leukemia |
| Glioma | Glioma |
| HNSCC | Head and Neck Squamous Cell Carcinoma |
| KIRC | Kidney Renal Clear Cell Carcinoma |
| LIHC | Liver Hepatocellular Carcinoma |
| MB | Medulloblastoma |
| MCC | Merkel cell carcinoma |
| MM | Multiple Myeloma |
| NET | Neuroendocrine Tumor |
| NHL | Non-Hodgkin Lymphoma |
| NSCLC | Non-small Cell Lung Cancer |
| OV | Ovarian Serous Cystadenocarcinoma |
| PAAD | Pancreatic Adenocarcinoma |
| SARC | Sarcoma |
| SCC | Squamous Cell Carcinoma |
| SKCM | Skin Cutaneous Melanoma |
| STAD | Stomach Adenocarcinoma |
| UCEC | Uterine Corpus Endometrial Carcinoma |
| UVM | Uveal Melanoma |
Cell type
| Abbreviation | Cell type |
|---|---|
| AC-like Malignant | Astrocyte-like Malignant Cells |
| Acinar | Acinar Cells |
| Alveolar | Alveolar Cells |
| Astrocyte | Astrocytes |
| B | B Cells |
| CD4Tconv | Conventional CD4 T Cells |
| CD8T | CD8 T Cells |
| CD8Tex | Exhausted CD8 T Cells |
| DC | Dendritic Cells |
| Ductal | Ductal Cells |
| Endocrine | Endocrine Cells |
| Endothelial | Endothelial Cells |
| Epithelial | Epithelial Cells |
| EryPro | Erythroid Progenitor Cells |
| Erythrocytes | Erythrocytes |
| Fibroblasts | Fibroblasts |
| Gland mucous | Gland Mucous Cells |
| GMP | Granulocyte-macrophage Progenitor Cells |
| Hepatic progenitor | Hepatic progenitor Cells |
| HSC | Hematopoietic Stem Cells |
| ILC | Innate Lymphoid Cells |
| Keratinocytes | Keratinocytes |
| Malignant | Malignant Cells |
| Mast | Mast Cells |
| Melanocytes | Melanocytes |
| Microglia | Microglia Cells |
| Mono/Macro | Monocytes or Macrophages |
| Myocyte | Myocytes |
| Myofibroblasts | Myofibroblasts |
| MES-like Malignant | Mesenchymal-like Malignant Cells |
| NB-like Malignant | Neuroblast-like Malignant Cells |
| Neuron | Neurons |
| Neutrophils | Neutrophils |
| NK | Natural Killer Cells |
| NPC-like Malignant | Neural-progenitor-like-like Malignant Cells |
| OC-like Malignant | Oligodendrocyte-like Malignant Cells |
| Oligodendrocyte | Oligodendrocytes |
| OPC | Oligodendrocyte Precursor Cells |
| OPC-like Malignant | Oligodendrocyte-precursor-cell-like Malignant Cells |
| Others | Other Cells |
| Pericytes | Pericytes |
| Pit mucous | Pit Mucous Cells |
| Plasma | Plasma Cells |
| Progenitor | Progenitor Cells |
| Promonocyte | Promonocytes |
| Secretory glandular | Secretory Glandular Cells |
| SMC | Smooth Muscle Cells |
| Stellate | Stellate Cells |
| Tprolif | Proliferating T Cells |
| Treg | Regulatory T Cells |
| Vascular | Vascular Cells |
FAQ (Frequently Asked Questions)
Citation
1. How to cite TISCH?
Dongqing Sun, Jin Wang, Ya Han, Xin Dong, Jun Ge, Rongbin Zheng, Xiaoying Shi, Binbin Wang, Ziyi Li, Pengfei Ren, Liangdong Sun, Yilv Yan, Peng Zhang, Fan Zhang, Taiwen Li, Chenfei Wang, TISCH: a comprehensive web resource enabling interactive single-cell transcriptome visualization of tumor microenvironment, Nucleic Acids Research, gkaa1020, https://doi.org/10.1093/nar/gkaa1020
Experession value
1. What's the units of the downloadable single-cell level expression matrices?
The values in the single-cell level expression matrix are normalized. We employed the global-scaling normalization method ('NormalizeData' function) in Seurat to scale the raw counts (UMI) in each cell to 10,000, and then log-transformed the results. And also, the gene expression level displayed using UMAP and violin plots in the Dataset page is quantified by the normalized values.
2. How to understand the values in the heatmaps and the violin plots of Gene page?
Firstly, in the Gene page, we converted raw count or FPKM, which depends on the available data, to TPM to ensure the expression level is relatively comparable between different datasets. The expression of a gene in the cell was quantified as log2(TPM/10+1). TPM values were divided by 10 to lower the impact of varying dropout rates between genes. Secondly, the values in the heatmap are mean expression values of the gene in different cell types of different datasets. And the mean values are the original ones in their own datasets, which means we didn't perform any normalization across multiple datasets.
Cell-type annotation
1. How did TISCH annotate the cell types?
The clusters of malignant cells were determined by combining three approaches. First, we took the cell-type annotations provided by the original studies. Second, we checked the malignant cell makers’ expression distribution from the initial research, such as epithelial markers, EMT genes, if available. Third, we ran InferCNV to predict cell malignancy based on the predicted copy number variation and separated the cells into malignant and non-malignant clusters. For the other normal clusters, we automatically annotated the cell clusters with a marker-based annotation method employed in MAESTRO using the DE genes between clusters, and then manually corrected the cell-type annotation results according to the cell-type annotations provided by the original studies. Please see the paper for more details.
Download
1. Is there a way to download all datasets in a batch?
Unfortunately, TISCH doesn't provide such a batch download function considering the bandwidth of the network.
2. How to download the pictures of high resolution in TISCH?
In the Dataset page, all the pictures can be saved to the local disk by right-clicking the image. In the Gene page, the heatmap can be downloaded by clicking the button at the top right corner. The violin plot in the Gene page can also be downloaded by right-clicking and selecting 'Save link as'.